You can use the actions for monitor management feature in our VDI App to enhance visibility into the performance of your monitor clusters. It helps your troubleshooting capabilities by providing more detailed views of your monitor clusters, sites, and connected data sources in the VDI App.
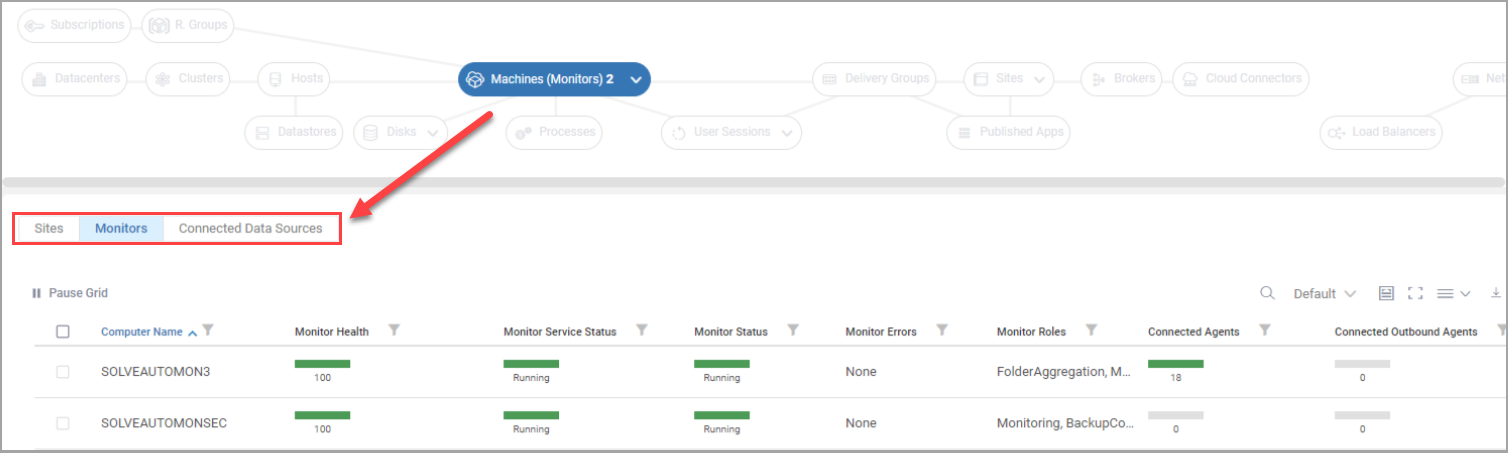
You can also use VDI App metrics to create triggers in the Real-Time DX Console. To display these metrics, open the Sites, Monitors, or Connected Data Sources views from the Machines (Monitor) topology:
Note
The new monitor metrics are not visible in the Real-Time DX Console, however they appear in the VDI App for version 9.0 and higher.
Run monitor actions
To open the monitor management menu:
In the Machines (Monitor) topology, right-click a machine, or select multiple machines as needed.
Select Monitor management and click the action that you want to implement on the monitor(s).
You can run the following actions on monitors in the VDI App:
Start monitor
Stop monitor
Restart monitor
Set monitor to maintenance
Set monitor capacity
Set public DNS name
Allow remediation actions
To allow our support team to remotely perform remediation actions on your monitors, run this PowerShell cmdlet.
Create triggers with monitor metrics
To create triggers based on monitor metrics:
In the Real-Time Console, perform these steps to create a trigger.
From the Record Type dropdown in the Add New Trigger popup, select either Folder or Machine, and click Next.
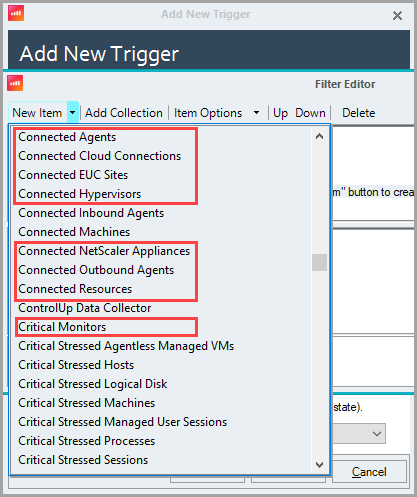
Click Filter editor… > New Item, and select the monitor metrics as needed to add conditions to the trigger:
Configure the conditions and follow-up actions as needed and click Finish.
Monitor metrics
You can use the following metrics as trigger conditions in the Real-Time Console for folder and machine record types:
Metric | Description | Value Calculation |
|---|---|---|
Actions Queue Size | Number of automated actions that are waiting in the monitor's queue | If the size is more than 1000, value reduced by 50% |
Automated Actions Health | Overall health of the Automated Actions queue | |
Average Data Collection Interval in Last Hour | Sites view: Average data collection interval from all monitors in this site in seconds | |
Monitors view: Average data collection interval for this monitor in the last hour | ||
Cluster Membership Role | Current membership role of this monitor within the cluster | |
Computer Name | Computer name | |
Connected Agents | Sites view: Number of agents connected to all monitors in this site | |
Monitors view: Number of agents connected to this monitor | ||
Connected Cloud Connections | Sites view: Number of cloud instances connected to all monitors in this site | |
Monitors view: Number of cloud instances connected to this monitor | ||
Connected EUC Sites | Sites view: Number of EUC sites connected to all monitors in this site | |
Monitors view: Number of EUC sites connected to this monitor | ||
Connected Hypervisors | Sites view: Number of hypervisors connected to all monitors in this site | |
Monitors view: Number of hypervisors connected to this monitor | ||
Connected NetScaler Appliances | Sites view: Number of NetScaler appliances connected to all monitors in this site | |
Monitors view: Number of NetScaler appliances connected to this monitor | ||
Connected Outbound Agents | Sites view: Number of outbound agents connected to all monitors in this site | |
Monitors view: Number of outbound agents connected to this monitor | ||
Connected Resources | Sites view: Number of resources connected to all monitors in this site | |
Monitors view: Number of all resources connected to this monitor | ||
Connected to Configuration | Indicates if the monitor is connected to the backend configuration services | |
Connected to Uploader Services | Indicates if the monitor is connected to the backend uploader services | |
Connection Error | Error message if this data source(s) isn’t in “Connected” state | |
Critical Monitors | Number of critical monitors in this site (Monitor Health < 10%) | |
Data Collection Interval | How long it took for the monitor to collect data from all its connected data sources |
|
Data Collector | Hostname of the active data collector assigned to this extension | |
Data Source | Name of the monitored data source | |
Degraded Monitors | Number of degraded monitors in this site (10% ≤ Monitor Health ≤ 80%) | |
Failed Monitors | Number of failed monitors in this site (Monitor Health = 0%) | |
FQDN | FQDN of the monitor machine | |
Healthy Monitors | Number of healthy monitors in this site (Monitor Health = 100%) | |
Is Agent Installed | Indicates if the ControlUp Agent is installed on this monitor machine | |
Is Aligned With Master | Indicates if this monitor is aligned with the master | If "False", Monitor Health is automatically 0%. Hence, a monitor without a master is considered "Critical". |
Is Configuration Service Accessible | Indicates if configuration service is accessible | |
Is Connected | Indicates if this data source is connected to the monitor | |
Is In Maintenance Mode | Indicates if this monitor is currently in maintenance mode | |
Last Credentials Synchronization | Timestamp indicating when this monitor last synchronized its credentials | |
Last Seen by Monitor Manager | When was this monitor last seen by the monitor that holds the manager role | |
Last Succeeded Insights Upload (UTC) | Timestamp of the last successful Insights upload | |
Last Succeeded Streaming Upload (UTC) | Timestamp of the last successful Streaming upload | |
Last Update | Timestamp of the monitor's last data retrieval | |
Low Impacted Monitors | Number of low-impacted monitors in this site (80% ≤ Monitor Health ≤ 99%) | |
Max Data Collection Duration in Last Hour | Sites view: Maximum data collection interval from all monitors in this site in seconds | |
Monitors view: Maximum data collection interval for this monitor in the last hour | ||
Memory Usage of Monitor Process (Private Bytes) | Represents the memory consumption of the cuMonitor.exe process | |
Memory Usage of Monitor Process (Working Set) | Represents the memory consumption of the cuMonitor.exe process | |
Memory Utilization | Memory utilization percentage | If higher than 97%, value reduced from 100%. For example, if Memory Utilization is 98%, Monitor Health = 2% (Critical). |
Monitor | Monitor name that is monitoring this data source | |
Monitor CPU | Monitor CPU | |
Monitor CPU Cores | Total number of CPU cores allocated to this monitor | |
Monitor CPU Speed | Clock speed of the CPU in MHz | |
Monitor Errors | Errors reported by this monitor | |
Monitor Health | Sites view: Health of all monitors in this site |
|
Monitors view: Overall health of this monitor | ||
Monitor Memory | Amount of physical memory assigned to this monitor | |
Monitor Roles | Monitor roles that this monitor currently holds | No Monitor Roles = 0% Monitor Health |
Monitor Service Status | Status of the monitor service | |
Monitor Start Time (UTC) | Start time of the monitor service (UTC time) | |
Monitor Status | Monitor status | 0% = Running or Started |
Monitor Version | Monitor version | |
Name | Site name | |
Number of Monitors | Number of monitors in this site | |
Public DNS Name | Public DNS name assigned to this monitor | |
Site Description | Description of this site | |
Site ID | Sites view: Site ID | |
Monitors view: Site ID the monitor belongs to | ||
Site Name | Monitors view: Name of the site the monitor belongs to | |
Connected Data Sources view: Current site assigned to the data source | ||
Source Type | Type of data source | |
State | Current connection state | |
Template | Monitor template | |
Used Capacity % | Sites view: Currently used capacity for this site | |
Monitors view: How much capacity this monitor is currently using | ||
Weight Usage Inbound | Shows the weight usage of all agents and data collectors that have inbound connectivity enabled | |
Weight Usage Outbound | Shows the weight usage of all agents that are marked as outbound ready |