The Load Balancing report shows the usage trends of the NetScaler load balancers in your organization by summarizing data about past activity and performance. You can view the data either individually for each load balancer, or in summary form, for all selected load balancers. By default, the selected time frame is the previous 24 hours.
Use the report to answer questions such as:
- Do I need to add more capacity to serve the load balancers?
- How many requests does a certain load balancer usually handle during business hours?
- Is load balancer traffic and behavior influencing user experience?
Report Functionality
The report provides the following functionalities:
- You can click a data point in the charts to view the minimum, average, and maximum number of client connections, request/response bits, and services bound to selected virtual servers during the selected time period.
- You can click a data series name on the bottom of the chart to highlight or toggle the series on the charts.
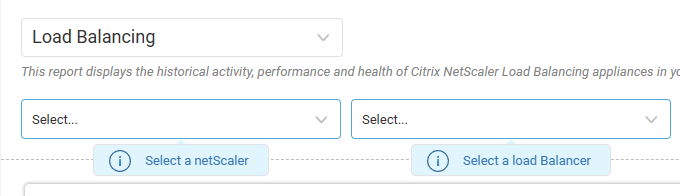
Select Which Load Balancers to View
By default, the report shows all load balancers in your environment.
To select which load balancers to include in the report:
- In the first dropdown, select which NetScalers to include.
- In the second dropdown, select which load balancers to include. The list of available load balancers depends on your selected NetScalers.
Select a Graph Display Mode
Select to view to plot all selected load balancing appliances on the graphs individually, or as a summary of all selected load balancers.
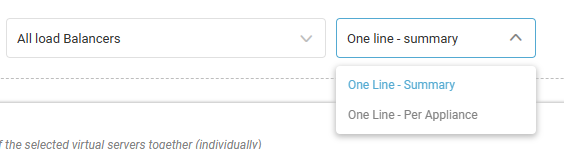
- One Line - Summary. By default, plots all selected load balancers as a single line. If the metric is a percentage, the value is the average of the percentages of all selected load balancers. For all other metrics, the value is the sum of the average values of all selected load balancers.
- One Line - Per Appliance. Plots all selected load balancers individually.
The report displays the following charts:
- Connections. Total (average) number of client connections to all (each) of the selected virtual servers together (individually).
- Traffic In/Out. Total (average) rate of request/response bits, for all (each) of the selected load balancers together (individually), in Mbps.
- vServer Health. Average percentage of services bound to all (each) of the selected virtual servers that were in an Upstate.
Column Descriptions
The Load Balancing report contains the following columns. You can click a Load Balancer name to display the details of the selected appliance in the grid.
| Column | Description |
| NetScaler Name | Name of the NetScaler. |
Load Balancer Name | Name of the Load Balancer. Click the name to open another NetScaler Load Balancing report with only this Load Balancer selected. |
Primary IP Address | IP address of the vServer. |
Primary Port | Port on which the service is running. |
Protocol | Protocol used by the Load Balancer for connections (HTTP, SSL, etc.). |
Traffic In | Average rate of request bits for the Load Balancer, in Mbps |
Traffic Out | Average rate of response bits for the Load Balancer, in Mbps. |
vServer Health | Average percentage of services bound to this virtual server that were in an Upstate. |
Active Services | Average number of active services bound to this virtual server. |
Inactive Services | Average number of inactive services bound to this virtual server. |
Hit Rate | Average rate per second of total requests received by this Load Balancer. |
Spill Over | Maximum number of spillovers experienced by the virtual server. |
Surge Count | Average number of requests in the surge queue. |
Method | Load-balancing method used by this Load Balancer (Round Robin, Least Connection, etc.). |