The device details page lets you monitor and manage all of your devices. You can:
- Create presets with customized views to see exactly the data and devices you need.
- Perform actions on devices, such as running scripts, initiating remote assistance, and power management.
- Drill down into a device to see the full details about the device.
- Organize your devices using groups and tags.
Access the Device Details Page
In ControlUp, go to the Devices > Details.
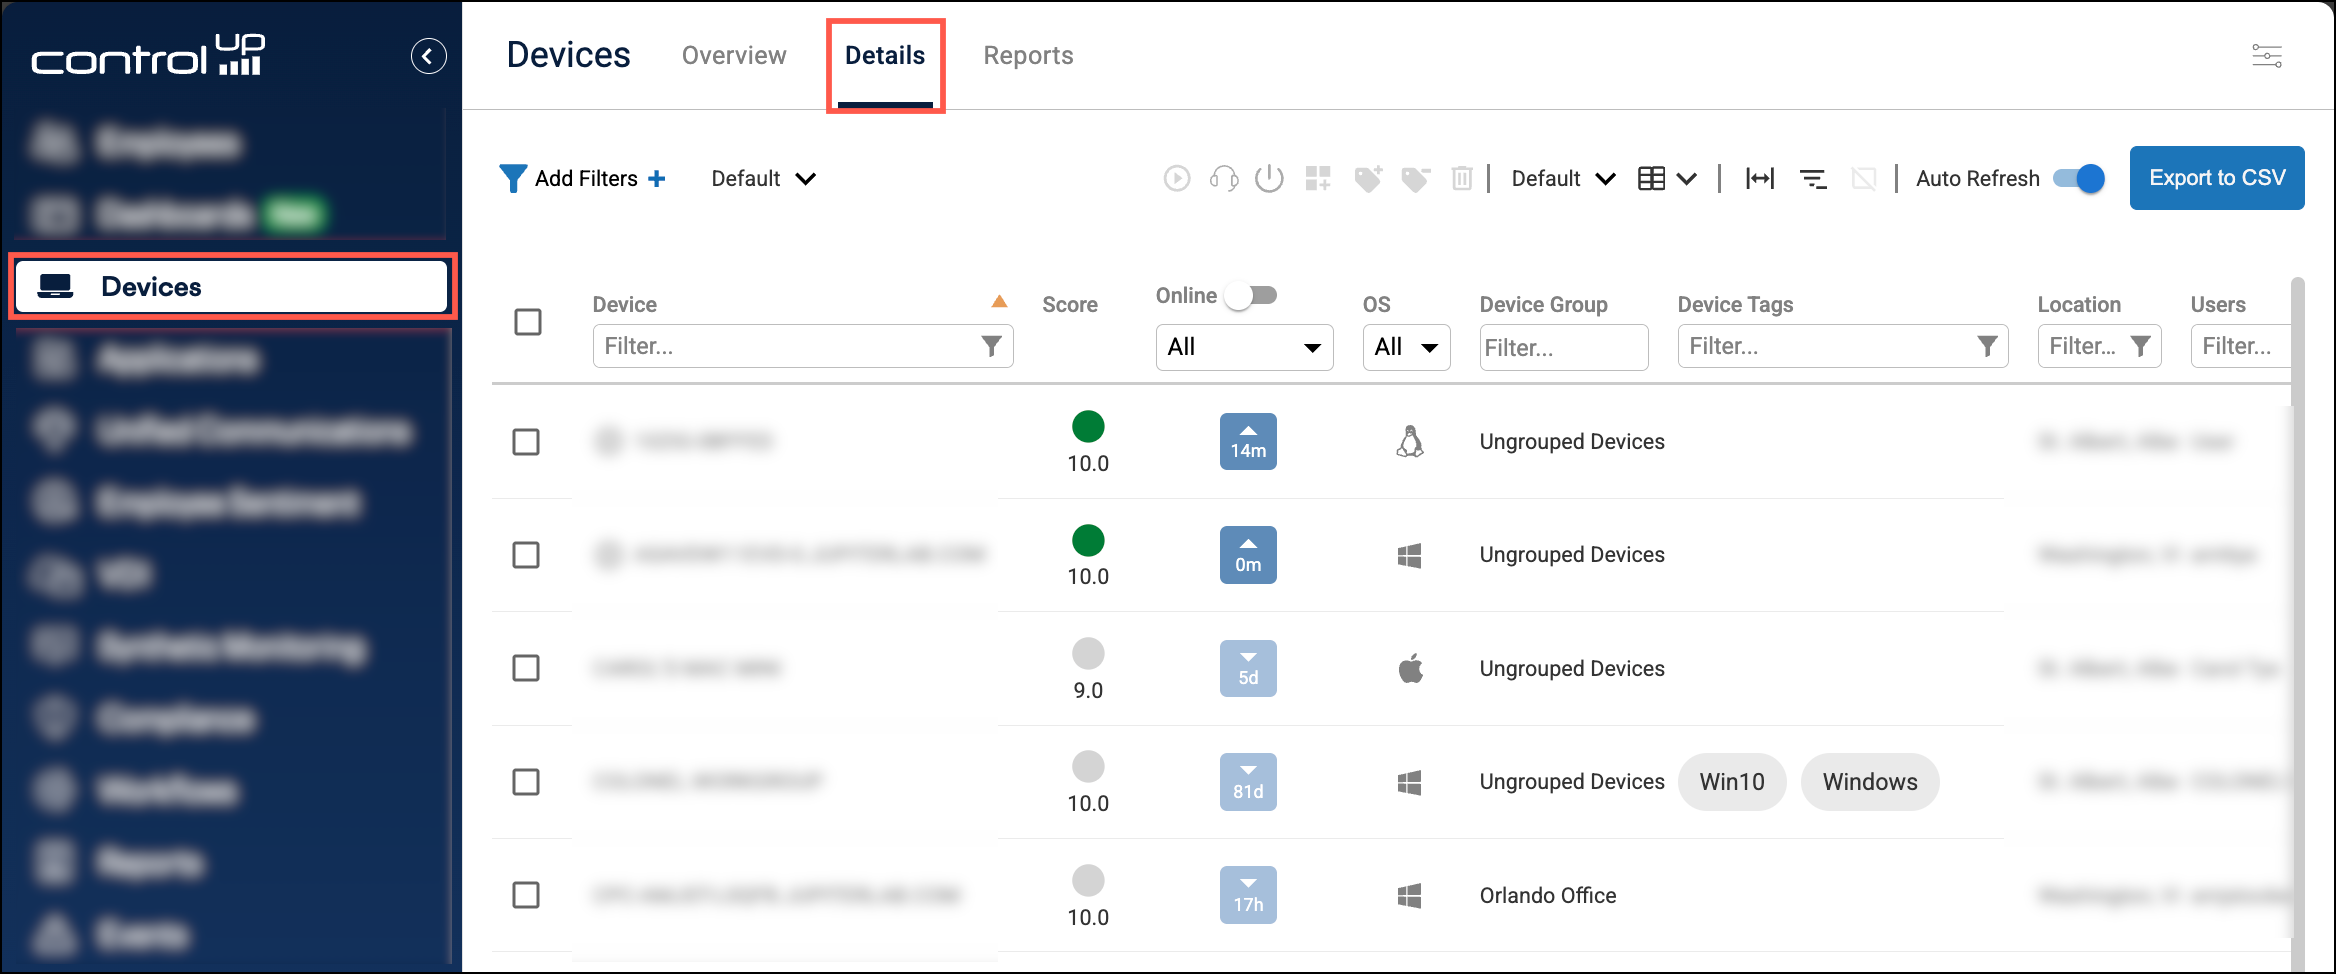
Device score
The Score column displays a 0-10 score indiciating the device's performance. To learn how this is calculated, read Device Score.
View online or offline devices
The Online column shows the time since devices last communicated to your tenant.
If a device has recently communicated, it is classified as Online and shows an up arrow with the time since the last agent communication. For example, the following device is online and the agent has communicated in the previous minute.

If a device has not communicated to your tenant within the last hour, it is classified as Offline and shows a down arrow with the time since the last agent communication. For example, the following device hasn't communicated in 85 days.

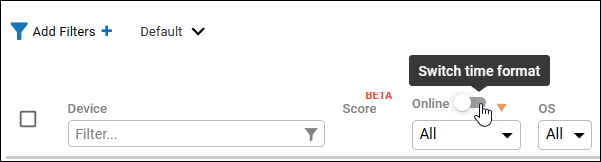
You can change the time format to show the exact time that the device last communication by selecting the toggle next to the Online column.
To filter the grid to show only online or offline devices, use the dropdown filter in the column header.
Column Presets
Choose which columns to display in the grid, and create presets to save grid views and quickly switch between them.
Presets automatically save any changes you make to the grid view with that preset selected. Presets save the following configurations:
- Displayed columns
- Column filters
- Column sorting
- Global filters
You can't edit the columns in the Default or Windows 365 presets. Create a new preset to edit its columns.
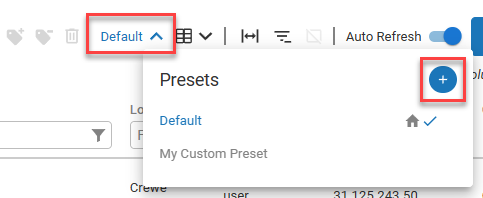
Create a new preset
-
Click the Presets selector at the top-right of the page.
-
Click the plus button to create a new preset.
-
Name the preset and click the save icon.
Add or remove columns to a preset
-
Click the Column Picker icon at the top-right of the page.
-
Select which preset you want to edit at the top of the column picker
-
The left side of the column picker shows all available columns. The right side of the column picker shows all currently displayed columns. Choose which columns you want to display by selecting them from the list of available columns.
-
If you want to remove displayed columns, you can deselect it on the left side, or click the X on the right side of the column picker.
-
Click and drag the displayed columns on the right side of the column picker to rearrange their order in the grid.
-
Click Apply to save your changes.
Duplicate an existing preset
- Click the Presets selector at the top-right of the page.
- Click the three-dots menu next to the preset you want to duplicate.
- Select Duplicate.
Set the default preset
- Click the Presets selector at the top-right of the page.
- Click the three-dots menu next to the preset you want to set as the default.
- Select Set as default.
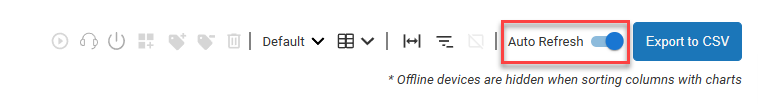
Auto Refresh Data
The data on the Devices page automatically refreshes every minute by default. Disable Auto Refresh to update the data only when the page reloads.
Filter and sort devices
If you have organized your devices with device groups and tags, these are a convenient way to can filter the list using the Device Group or Device Tag column using the methods described below. This is useful if you want to quickly see data or perform an action on all devices in a certain group or with a certain tag. To learn more about device groups and tags, and what they can be used for, visit Organize Devices with Groups and Tags.
When you sort or filter a column with a chart or score, such as the CPU Usage Timeline or Score columns, all offline devices are hidden.
You can filter the list of devices based on:
- Displayed columns
- Any column (displayed or nondisplayed) using the global filter selector
Filter a displayed column
-
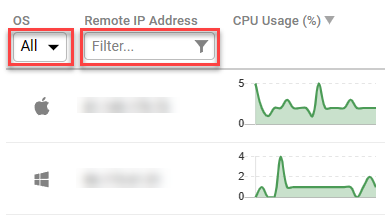
Find the column that you want to use as a filter. If there is a filter selector under the column name, then you can add filters for that column. For example, you can filter by the OS or Remote IP Address columns.
-
Apply a filter to the column. You can either:
- Enter text in the filter box to show results containing the string you entered.
- Select an item from the filter dropdown.
- Click the filter icon for more filtering options, or to add multiple filter conditions with AND/OR logic.
- Paste a list of values separated by a new line into a text column filter to show all devices matching one of the values. For example, this can be useful if you receive a list of device names and want to perform an action on all of the devices. Note that this method is recommended only up to a few dozen devices. If you have to filter many devices (hundreds or thousands), then you should use other filtering methods, or use the API to perform the action on the list of devices.
Filter a displayed or nondisplayed column
-
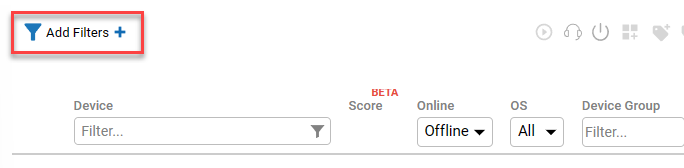
Click Add filters at the top-left of the page to add global filters to the device list.
-
Add one or more filter conditions based on the column you select. Note that you can select a column to filter even if that column is not currently displayed in your current grid preset.
-
Click Apply Filters.
Sort a column
To sort the list of devices based on a column, click the name of a column in the table header.
Clear all filters/sorters
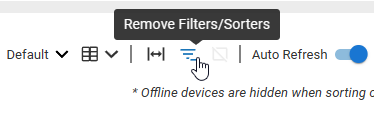
Click the Remove filters/sorters button at the top-right of the page to remove all filters and sorters.
Drill down to details for a specific device
Click on a device's name to view more detailed information for that device.
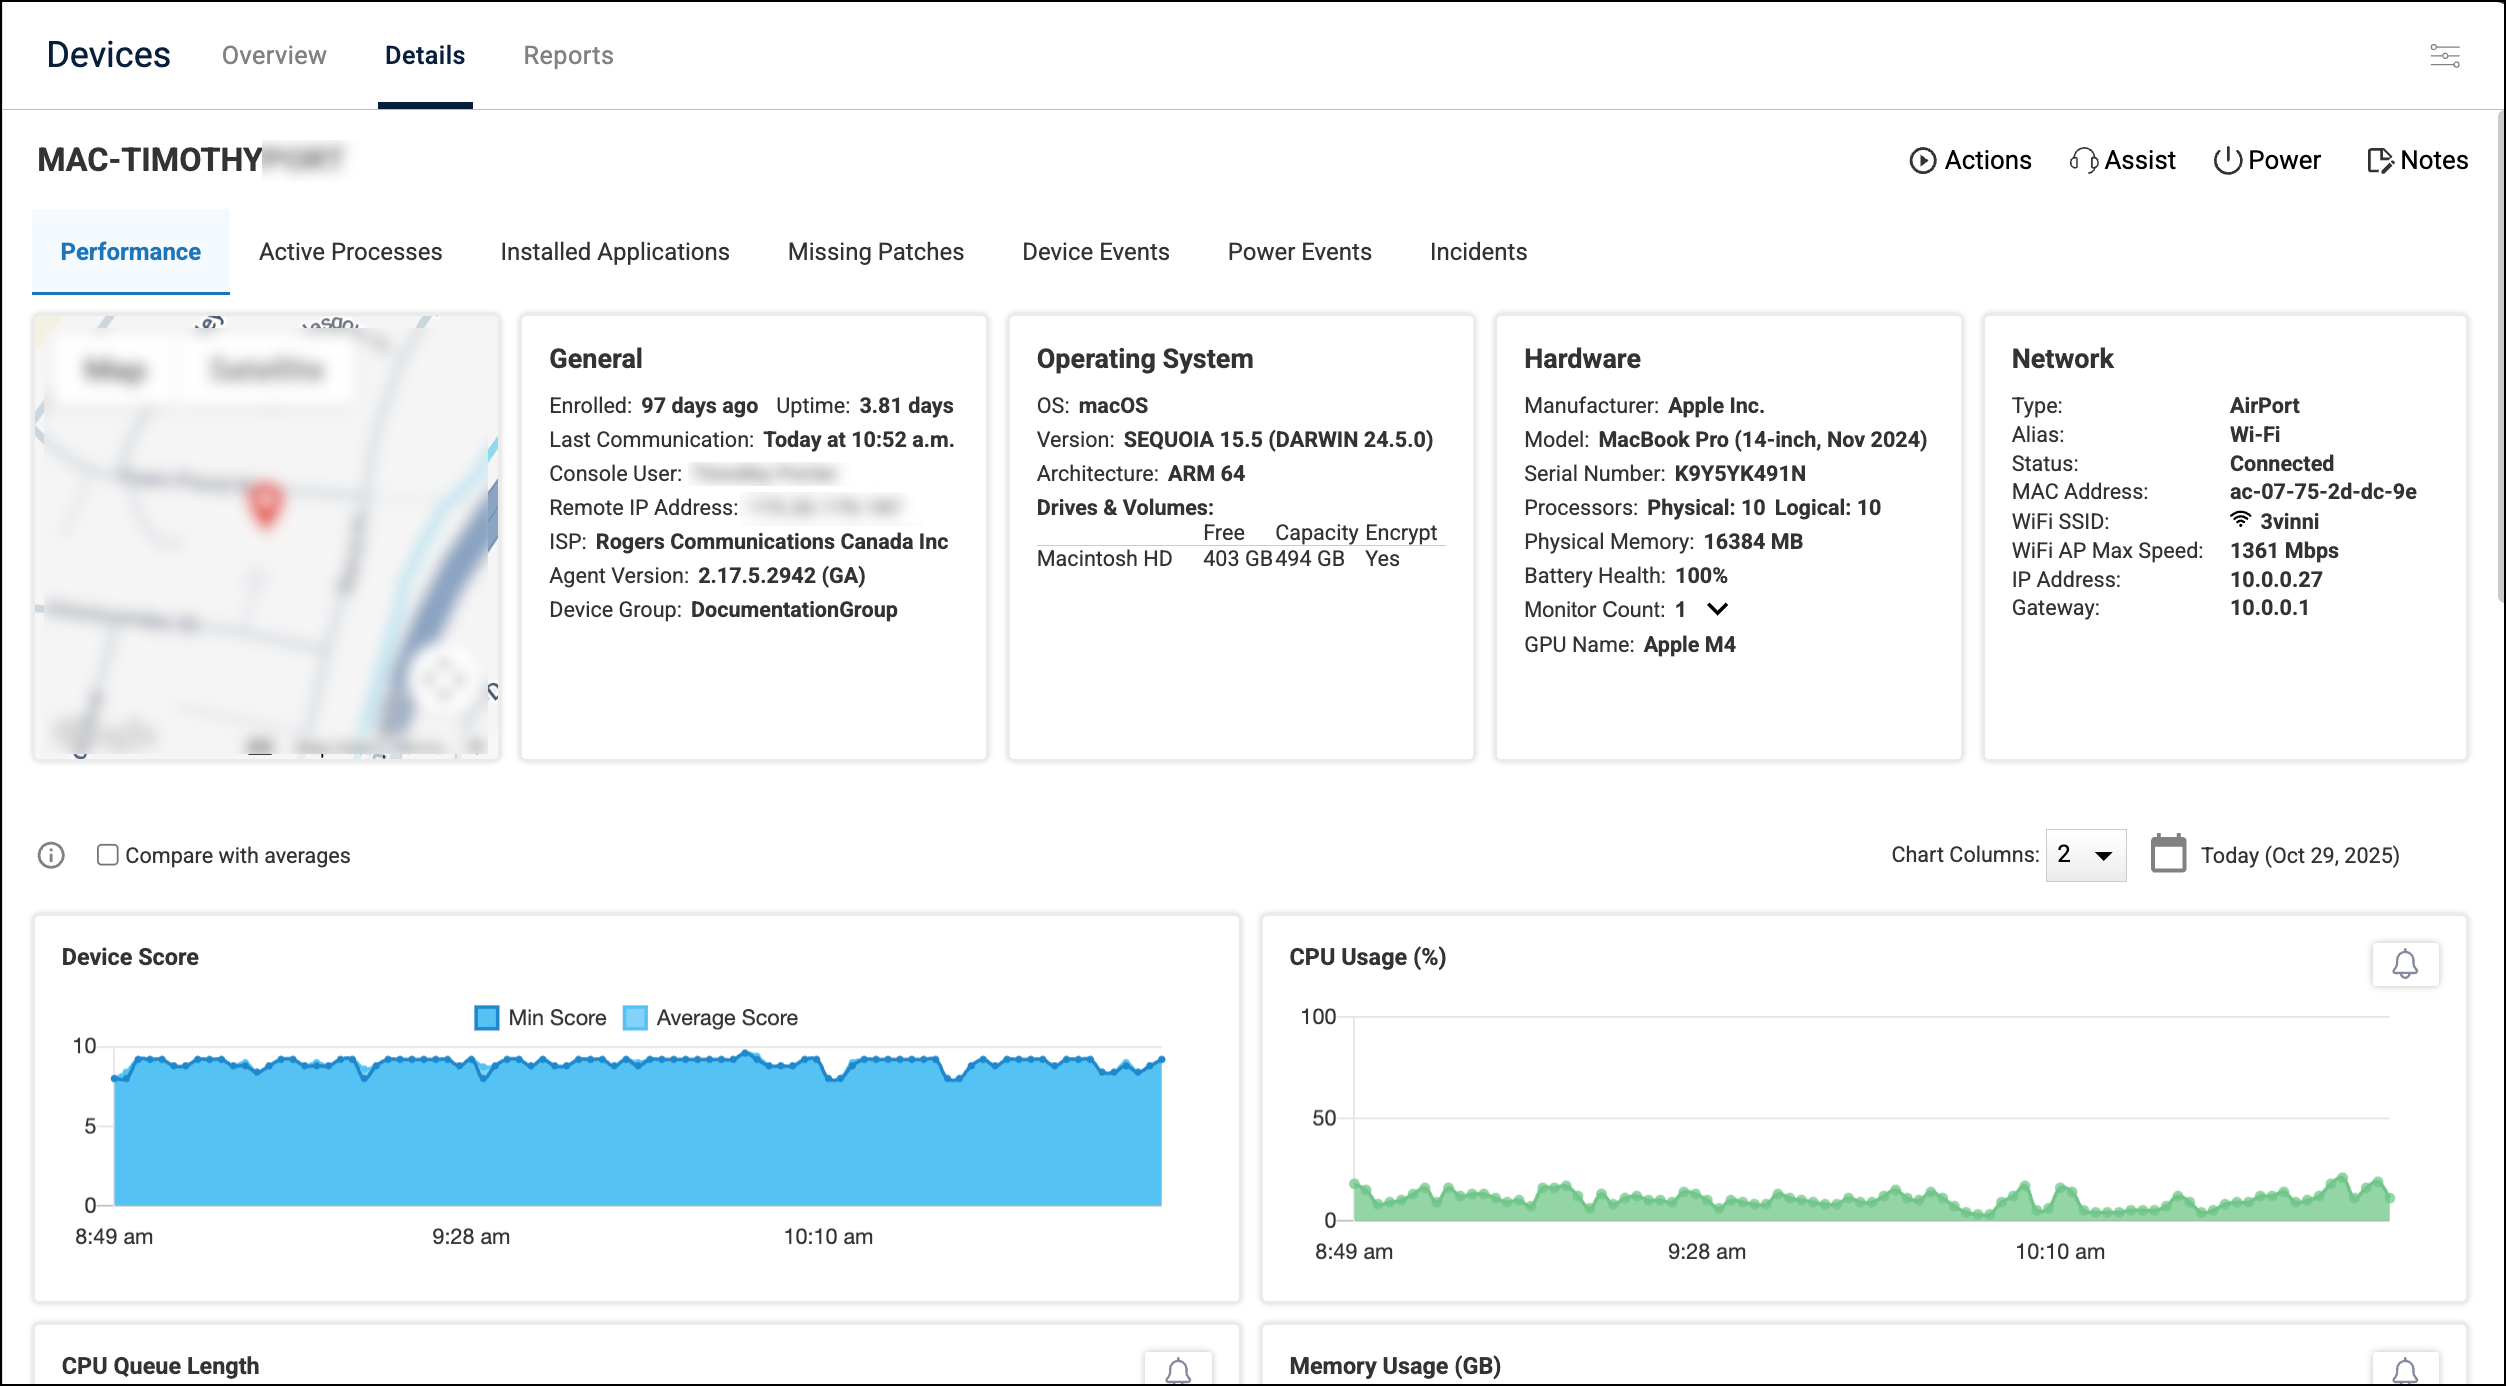
From this page, you can:
- Run actions on the device from the top-right corner.
- Use the tabs at the top of the page to select what kind of data to view.
- Compare the device's performance data with the average of other devices. To do this, go to the Performance tab, and select the Compare with averages checkbox above the widgets. The widgets are overlayed with average data from all devices in your environment. Next to the checkbox, you can apply filters to narrow down which devices are used for the comparison.
- View live 3-second metric updates (available for Windows devices only). Set the date picker to Now to establish a connection to the device and receive 3-second metric updates from the device. To view this, you must have the Performance permission under the Device Permissions > Remote Management category. Note that only one ControlUp user at a time can be connected to a specific device for 3-second updates.
.png)