Sometimes session metric data includes values which are outliers with respect to the majority of the data, causing the results of the aggregated average calculations to be skewed.
With ControlUp, you can prevent such skewing for some metrics of the aggregated average calculations by excluding extreme values from the calculations (see table below). You can do so by setting an upper limit for the metric, as explained below.
| Session Metric | Aggregated Average |
|---|---|
| Logon Duration | Avg. Logon Duration |
| Latency Last | Sessions Avg. Protocol Latency |
| User Input Delay | Avg. User Input Delay |
For more information on the session metrics Logon Duration, Latency Last, and User Input Delay, see Sessions View & Actions.
Prerequisite
- Administrative access to the ControlUp Monitor machine to run the Powershell cmdlet.
What are aggregated metrics?
Aggregated metrics that are session-related include Avg. Logon Duration, Sessions Avg. Protocol Latency and Avg. User Input Delay.
Before you define upper limits, you must understand what aggregated metrics are. Aggregated metrics are average values calculated by ControlUp. For example, the Avg. Logon Duration metric is the mean of all Logon Duration values for all sessions in a specific folder. You can find aggregated columns in the Folder tab in the ControlUp Real-Time DX Console:

In the web UI, Avg. Logon Duration and Avg. Protocol Latency are shown as widgets under the User Sessions dropdown in VDI & DaaS > Details. Avg. User Input Delay is shown in the data grid below:

When and why should you set limits?
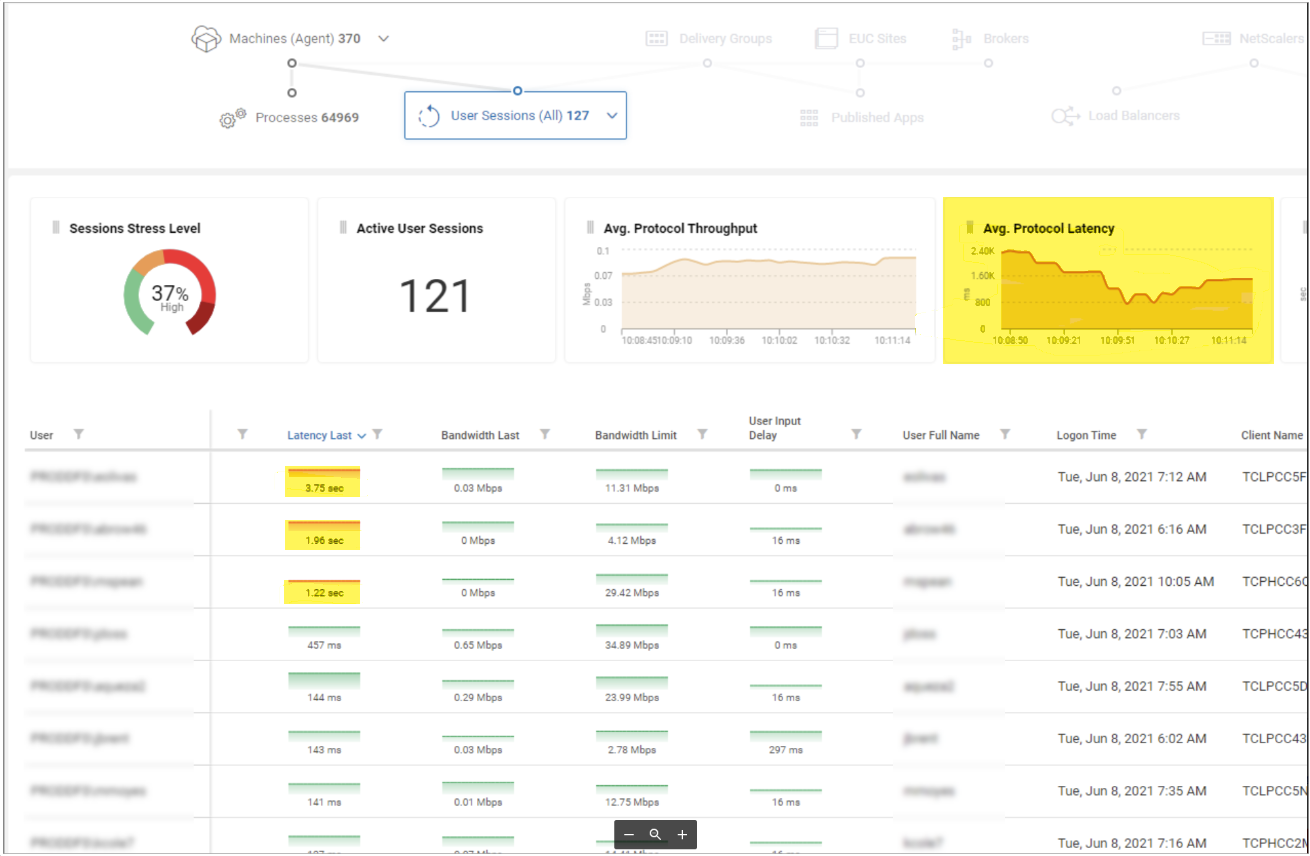
The following example shows the problem with outliers:

The screenshot above shows the Avg. Protocol Latency widget in the web UI. In the line graph, you can see that the average values range between 800 ms and 2400 ms, although most values in the Latency Last column are below 500 ms. The three extreme data values highlighted in the Latency Last column make the information in the widget less useful.
Default Settings
The default settings for upper limits on the session metrics are the following:
| Session Metric | Aggregated Average | Default for Upper Limit |
|---|---|---|
| Logon Duration | Avg. Logon Duration | By default, outlier values greater than 1800 seconds are not included in the calculation of the Avg. Logon Duration. |
| Latency Last | Sessions Avg. Protocol Latency | By default, outlier values greater than 5000 milliseconds are not included in the calculation of the Sessions Avg. Protocol Latency. |
| User Input Delay | Avg. User Input Delay | By default, no upper limit is set. All User Input Delay values are included in the calculation of the Avg. User Input Delay. |
How can I change limits?
You can set upper limits for the session metrics Logon Duration, Latency Last and User Input Delay by using the Set-ColumnLimitConfig PowerShell cmdlet.
To set an upper limit for a session metric:
- Connect to your monitor machine with a user that has administrative rights.
- Open an elevated PowerShell ISE as an administrator.
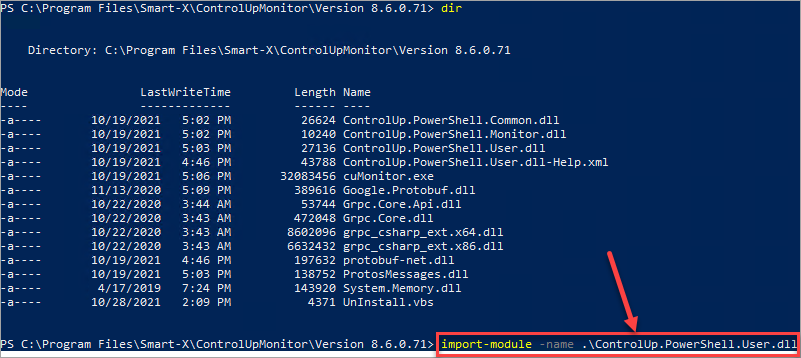
- Import the ControlUp.PowerShell.User.dll module to the PowerShell session
$pathtomodule = (Get-ChildItem "C:\Program Files\Smart-X\ControlUpMonitor\*ControlUp.PowerShell.User.dll" -Recurse | Sort-Object LastWriteTime -Descending)[0]
Import-Module $pathtomodule

4. Set a value for an upper limit for a session metric (Logon Duration, Latency Last or User Input Delay) by executing the relevant PowerShell command:
Logon Duration
To set an upper limit for the Logon Duration metric, run a PowerShell command such as the example shown below, which sets the upper limit at 99 seconds:
Set-ColumnLimitConfig -TableName "Sessions" -ColumnName "LogonDuration" -Limit 99
As a result, values in the Logon Duration column above 99 seconds are not taken into account in the calculation of the Avg. Logon Duration.
Latency Last
To set an upper limit for the Latency Last metric, run a PowerShell command such as the example shown below, which sets the upper limit at 100 milliseconds:
Set-ColumnLimitConfig -TableName "Sessions" -ColumnName "SessionLatency" -Limit 100
As a result, values in the Latency Last column above 100 milliseconds are not taken into account in the calculation of the Sessions Avg. Protocol Latency.
User Input Delay
To set an upper limit for the User Input Delay metric, run a PowerShell command such as the example shown below, which sets the upper limit at 15 seconds.:
Set-ColumnLimitConfig -TableName "Sessions" -ColumnName "UserInputDelay" -Limit 15
As a result, values in the User Input Delay column above 15 seconds are not taken into account in the calculation of the Avg. User Input Delay.
As shown above, the PowerShell cmdlet doesn't require a unit as an input parameter. Its not necessary to provide seconds, milliseconds, etc. to the script.
How can I retrieve current limits?
While the Set-ColumnLimitConfig cmdlet is used to set a limit, you can use the Get-ColumnLimitConfig cmdlet with the same input parameters to retrieve the currently set limit. The following command returns the currently used upper limit for the Logon Duration column:
Get-ColumnLimitConfig -TableName "Sessions" -ColumnName "LogonDuration"

Current limits for Latency Last and User Input Delay can be retrieved in the same way, using the command above and specifying "LatencyLast" or "UserInputDelay" as the relevant ColumnName.
Color scheme for exceeding upper limits
Whenever the Logon Duration, Latency Last or User Input Delay metrics exceed the configured upper limit, the color scheme of the display changes accordingly, regardless of how the thresholds are configured in the Stress Level Settings.
In the example shown below, the metric display for Logon Duration is shown to appear in red when the value of the metric exceeds the configured upper limit of 35 seconds.
