You can export the grid on the Discovery page to a CSV file, and export historical reports to a CSV or a PDF file if you need to perform analysis outside of the VDI App or share information.
Export Discovery Real-Time Grid
The export feature on the Discovery page takes a snapshot of the real-time grid for the selected topology layer. You can export a maximum of 30 columns and 1,000 records (rows).
To export the real-time grid from the Discovery page:
-
Click the download icon to open the Export grid window after sorting and filtering the columns, if necessary.
If you want to export only specific records, you should select them before starting the export process. See step 3 for more details.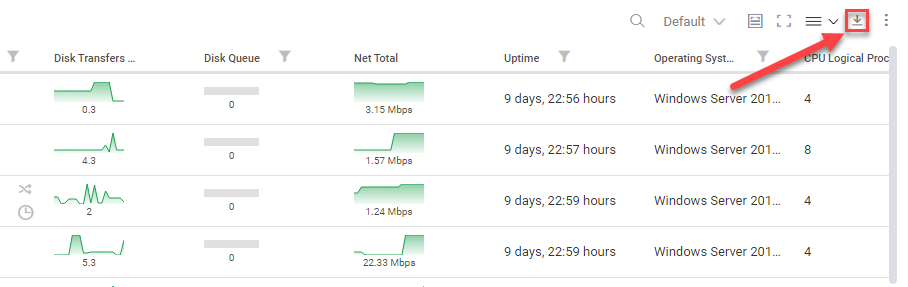
-
In the Columns to export dropdown menu, add and remove columns to the export list, and rearrange the order of the columns in the CSV file. By default, all columns currently appearing in the real-time grid are selected (presets are a greay way to manage these columns). You can search for and add any column to export—not just the ones currently displayed in the real-time grid. The first column (in this case, Name), along with any sorted or filtered columns, are locked and can't be removed from the export list.
-
Choose the records to export. You can either select a range, so the records currently appear in the real-time grid, or make a custom selection with Selected records only.
To export a custom selection of records, you must first select the records with checkboxes in the real-time grid before starting the export process.
- Click Download, and your browser downloads the CSV file. The actual snapshot of the real-time grid happens when you click Download, and not when you open the Export grid window. The export feature always gets the current data, even if the real-time grid is paused.
The file name indicates the topology level, and the date and time of the snapshot. For example, CU VDI App - User Sessions - 06_13_2024_17_58_22. The date and time format is mm_dd_yyyy_hh_mm_ss.
Export Historical Report
Export Historical Reports to a CSV or PDF file. A CSV export contains only the rows and columns in the report grid. A PDF export contains only the graph widgets in a report.
To export a report:
-
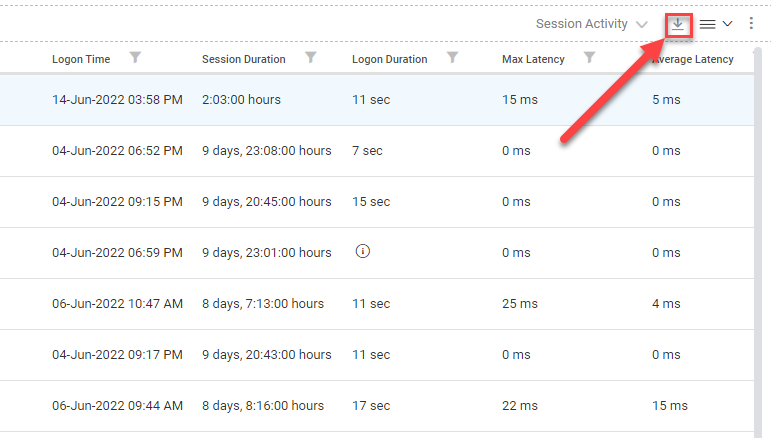
Click the download icon to open the Export Report window after sorting and filtering the columns, if necessary.
-
Select the Format for the export. The available file formats depend on the report. If the report has both a grid and graph widgets, then you can select CSV to export the grid or you can select PDF to export the graph widgets.
-
Enter a Report Name and an email address. ControlUp sends the exported file to the entered email address if the download takes too long in your browser.
-
Click Download, and your browser downloads the CSV file. The file name contains the Report Name, and the time range of the report. For example, CU VDI App - Session Activity - 24H.