Licensed Users
This feature is available only to users with a license for it.
Pulse is ControlUp’s AI‑powered command and control center in the DEX platform. It continuously detects issues that impact employee productivity and analyzes root causes using advanced AI.
Pulse powers ControlUp Connect to provide your end-user’s self-service and proactive detection right on their desktops.
Pulse allows you to view the end user’s AI interactions with Connect. It analyzes patterns of both Connect’s self-service initiated chats, as well as our proactive detections. Pulse then learns these patterns and the best remediation steps to constantly improve your end users’ experience.
What It Does
Pulse brings together real‑time monitoring and AI‑driven investigation to keep your digital environment healthy and productive:
AI‑Powered Investigation: Uses advanced LLM‑based analysis to determine root causes quickly and accurately.
Smart Remediation: Provides recommended remediation actions with risk‑based approval workflows.
Continuous Pattern Learning: Learns from past investigations to improve detection accuracy and accelerate future troubleshooting.
Supported Environments
Windows physical desktops (10 and 11) and servers
Windows-based VDI environments
Access Pulse
Click the Pulse icon on the left navigation bar to open the Investigations page.
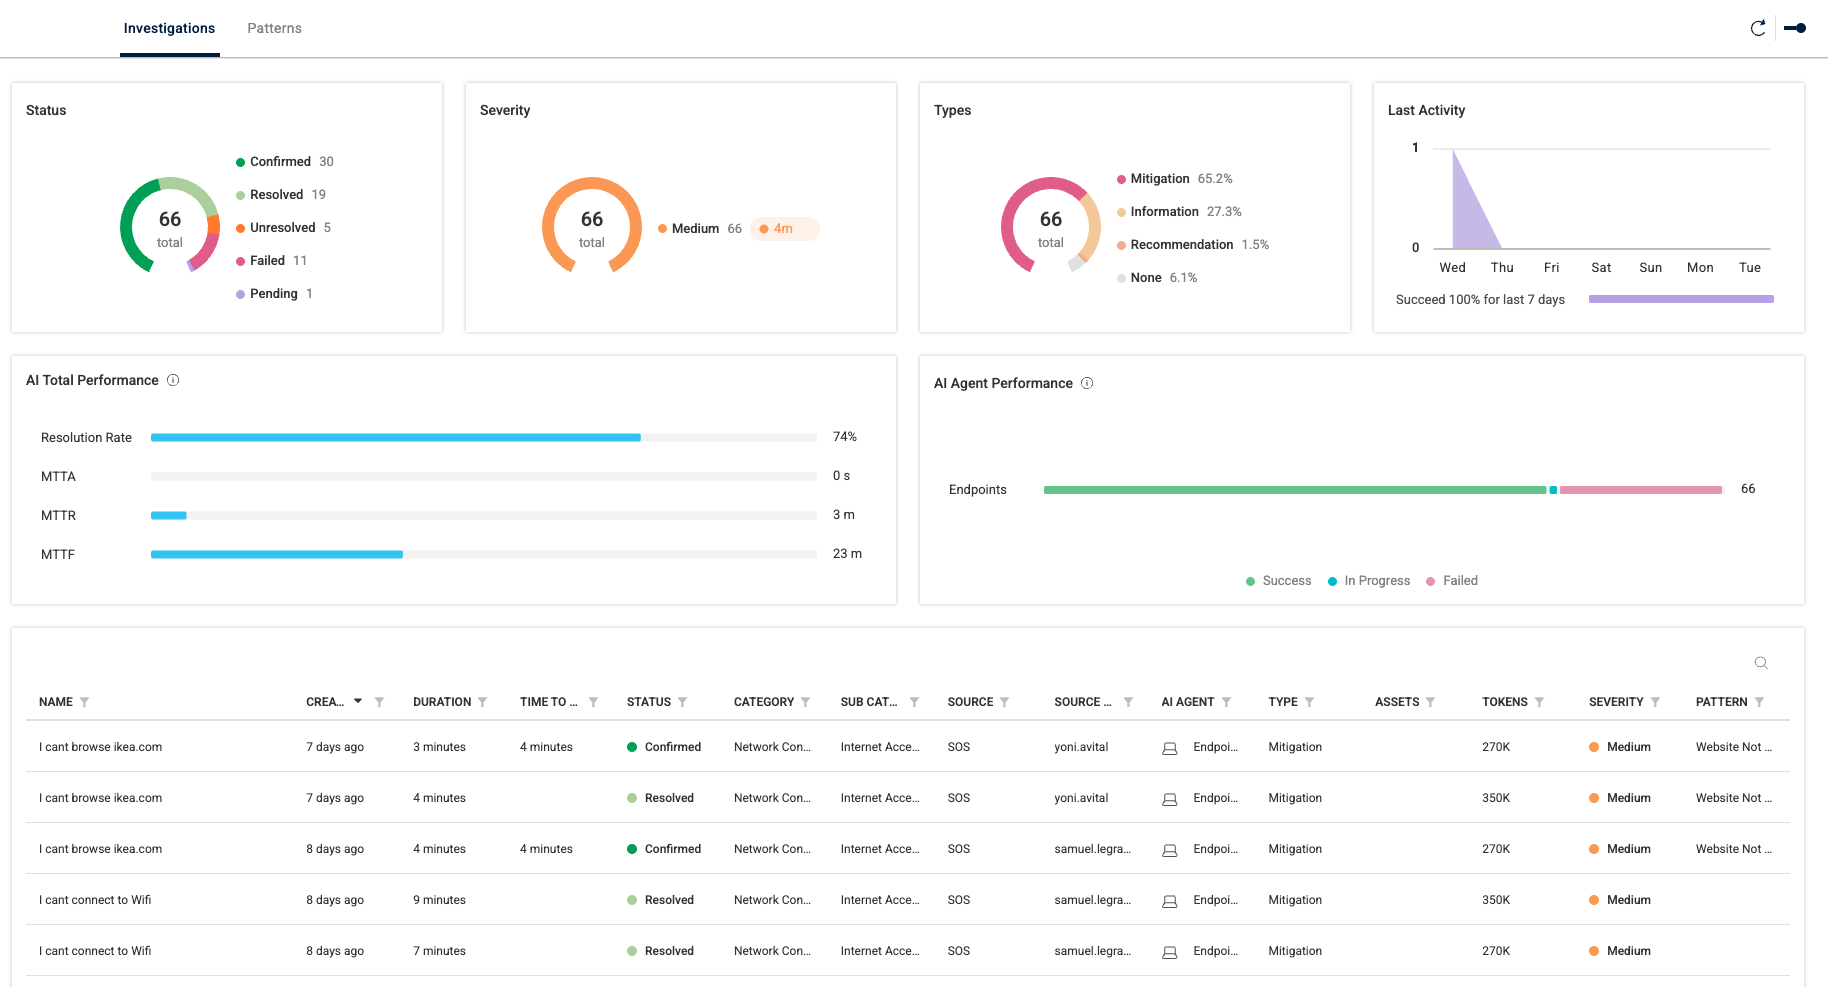
The Investigations page displays an overview of all investigations performed in Connect. Click the widgets or charts to view the following investigations details:
Investigations Widget | Details |
|---|---|
Status | Status can be:
|
Severity | Severity can be:
|
Types | Types include:
|
Last Activity | Rate of resolution for open investigations over the last 7 days |
AI Total Performance | Shows aggregated AI performance according to:
|
AI Agent Performance | Count of AI agents current performance status on endpoints. Can be:
|
The data grid at the bottom of the page shows additional details for each investigation.
Investigation Details
To drill down to the details page of a single investigation, click a row.
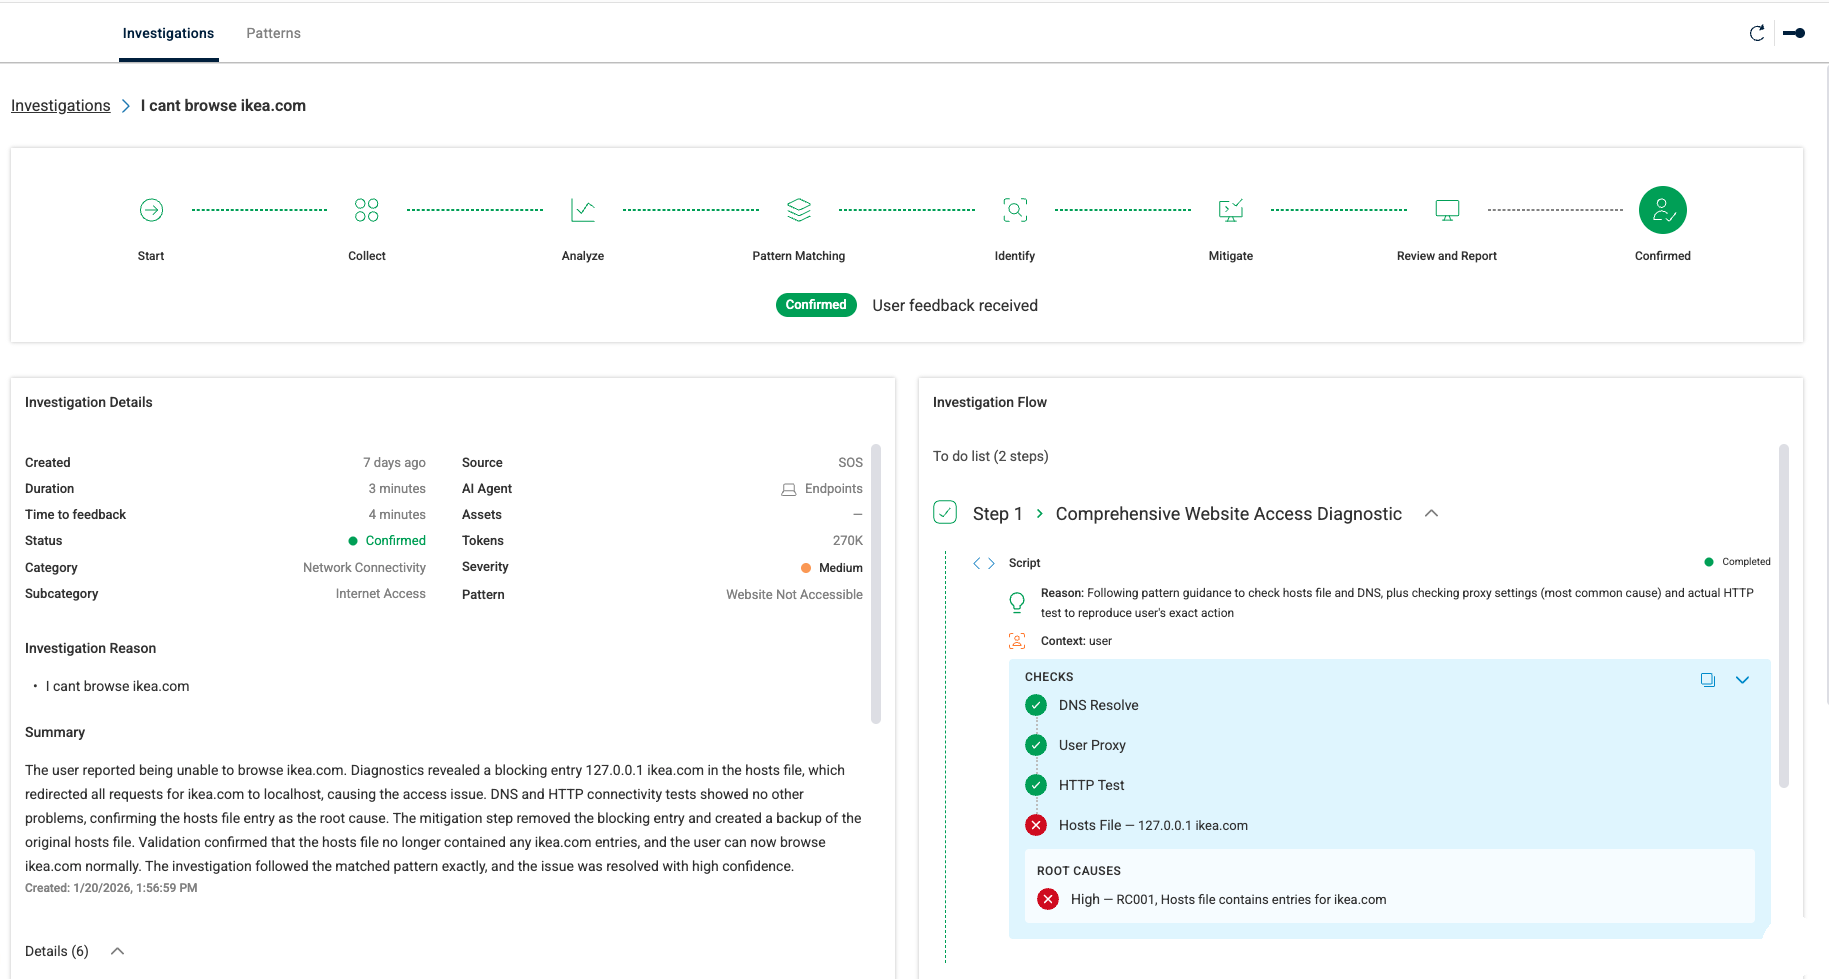
The investigation details page gives you a complete, end‑to‑end view of how Pulse detected, analyzed, and diagnosed an issue. It brings relevant context, evidence, and AI‑driven insights into a single space so you can understand exactly what happened and why.
Components
Investigation Timeline
A visual progress bar at the top shows each stage of the investigation, from data collection and analysis to pattern matching, root‑cause identification, mitigation, and confirmation. It clearly shows how far the investigation has progressed and what actions were taken.
Investigation Details
The Investigation Details panel summarizes the full context of the issue, including:
Creation time and duration of the investigation
Time to feedback, showing how quickly the issue was identified
Source (e.g., AI Agent, endpoint, application)
Category and subcategory indicating the type of problem detected
Severity level
Investigation reason
Detailed summary explaining what the user reported, what Pulse found, and how it validated the issue
Investigation Flow
The Investigation Flow panel breaks down the diagnostic process step‑by‑step. Each step includes:
List of checks performed (such as DNS, proxy, HTTP testing, or file validation)
Results for each check, with color‑coded tags
Identified root causes, with severity tags
Pulse displays exactly what it tested, what succeeded or failed, and what evidence led to the identified root cause.
AI Advisor Panel
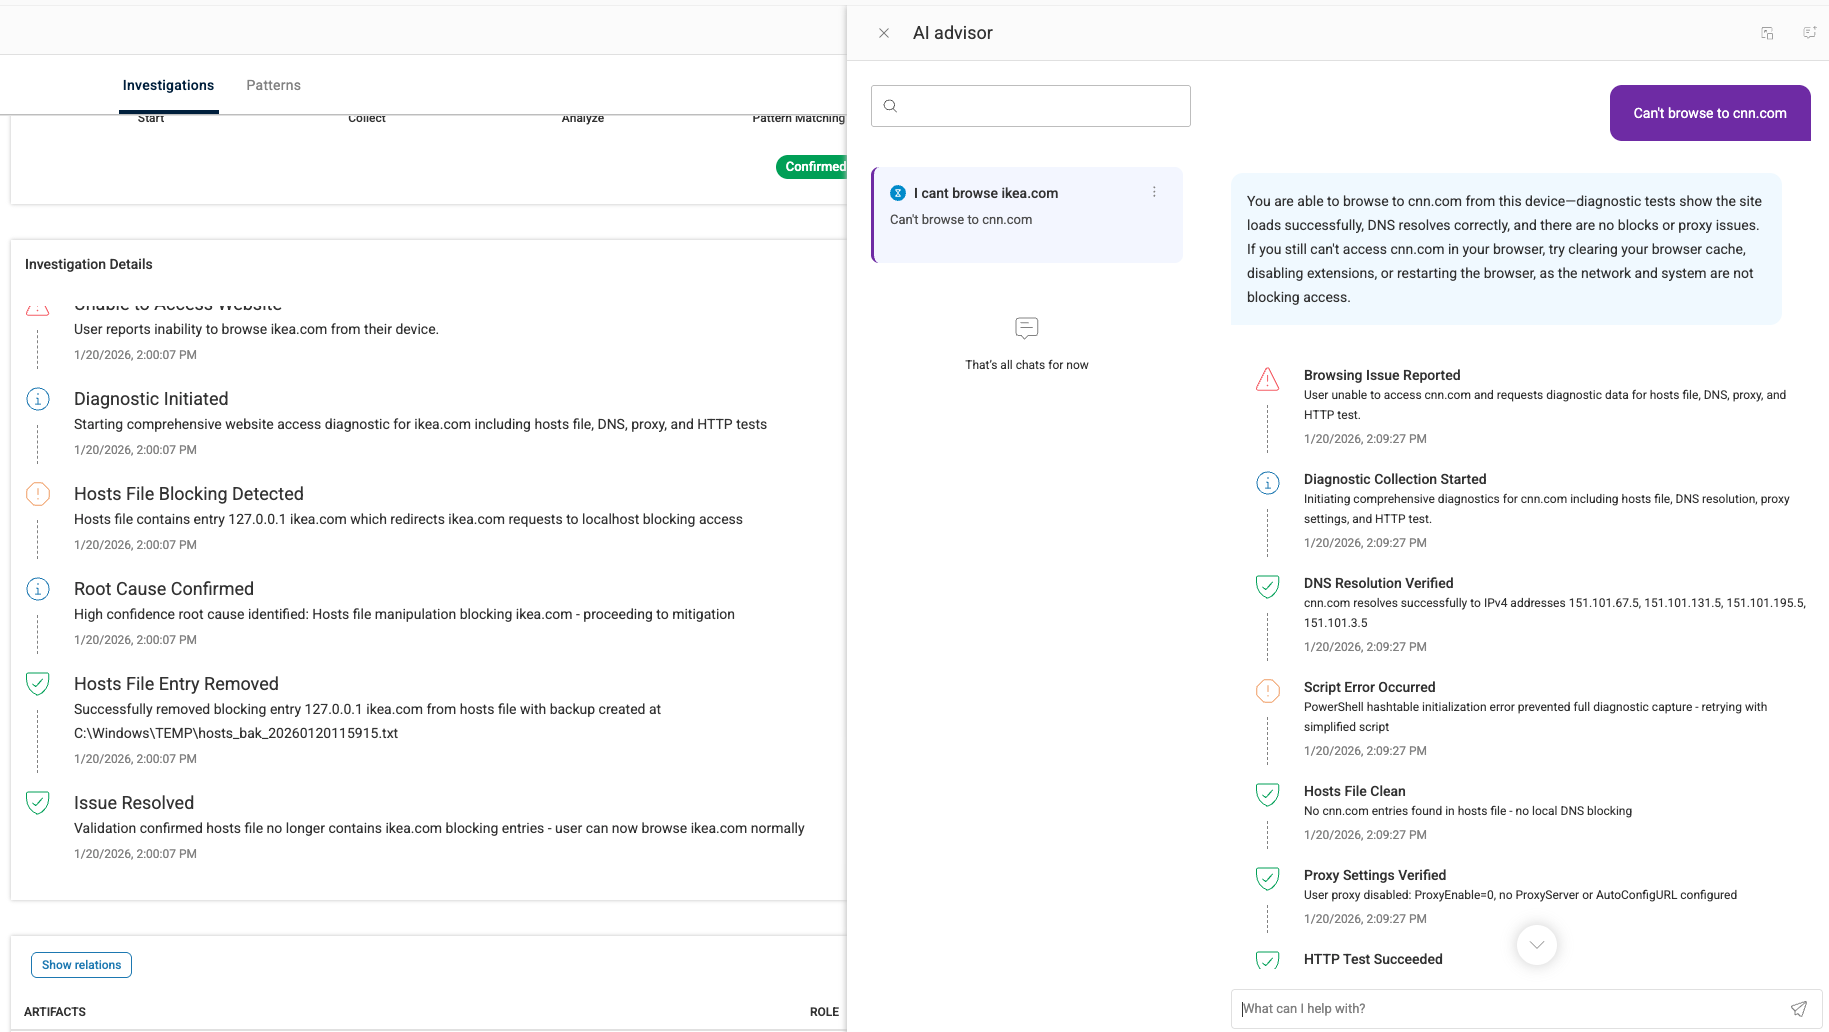
The AI Advisor panel provides real‑time, AI‑generated guidance to help you understand, validate, and analyze issues surfaced during an investigation. It consolidates diagnostic findings, user‑visible symptoms, and recommended next steps into a single, easy‑to‑read view.
Centralized Issue Summary
The AI Advisor displays the current issue being analyzed, along with a concise, natural‑language explanation of what has been identified. This gives you immediate clarity on why the user is experiencing a problem and what the AI has already validated.
Context‑Aware AI Guidance
Pulse automatically interprets diagnostic results, such as DNS checks, proxy tests, script execution status, and file validations, and explains what they mean in practical terms. The AI summarization helps you understand the situation without digging through raw technical output.
Step‑by‑Step Diagnostic Timeline
A chronological activity feed shows the checks performed during the investigation, including:
Tests that succeeded
Tests that failed
Detected anomalies
Actions retried or escalated
Each item includes a timestamp and clear visual indicators so you can quickly track what happened and when.
Conversation‑Style Interaction
At the bottom of the panel, you can engage with the AI Advisor to request additional clarification, ask follow‑up questions, or get deeper insight into test results. This turns the investigation report into an interactive troubleshooting assistant.
Relational Graph
The Relational Graph gives you a visual, interconnected view of all artifacts involved in an investigation, helping you quickly understand how different events, processes, files, and metrics relate to the issue identified.
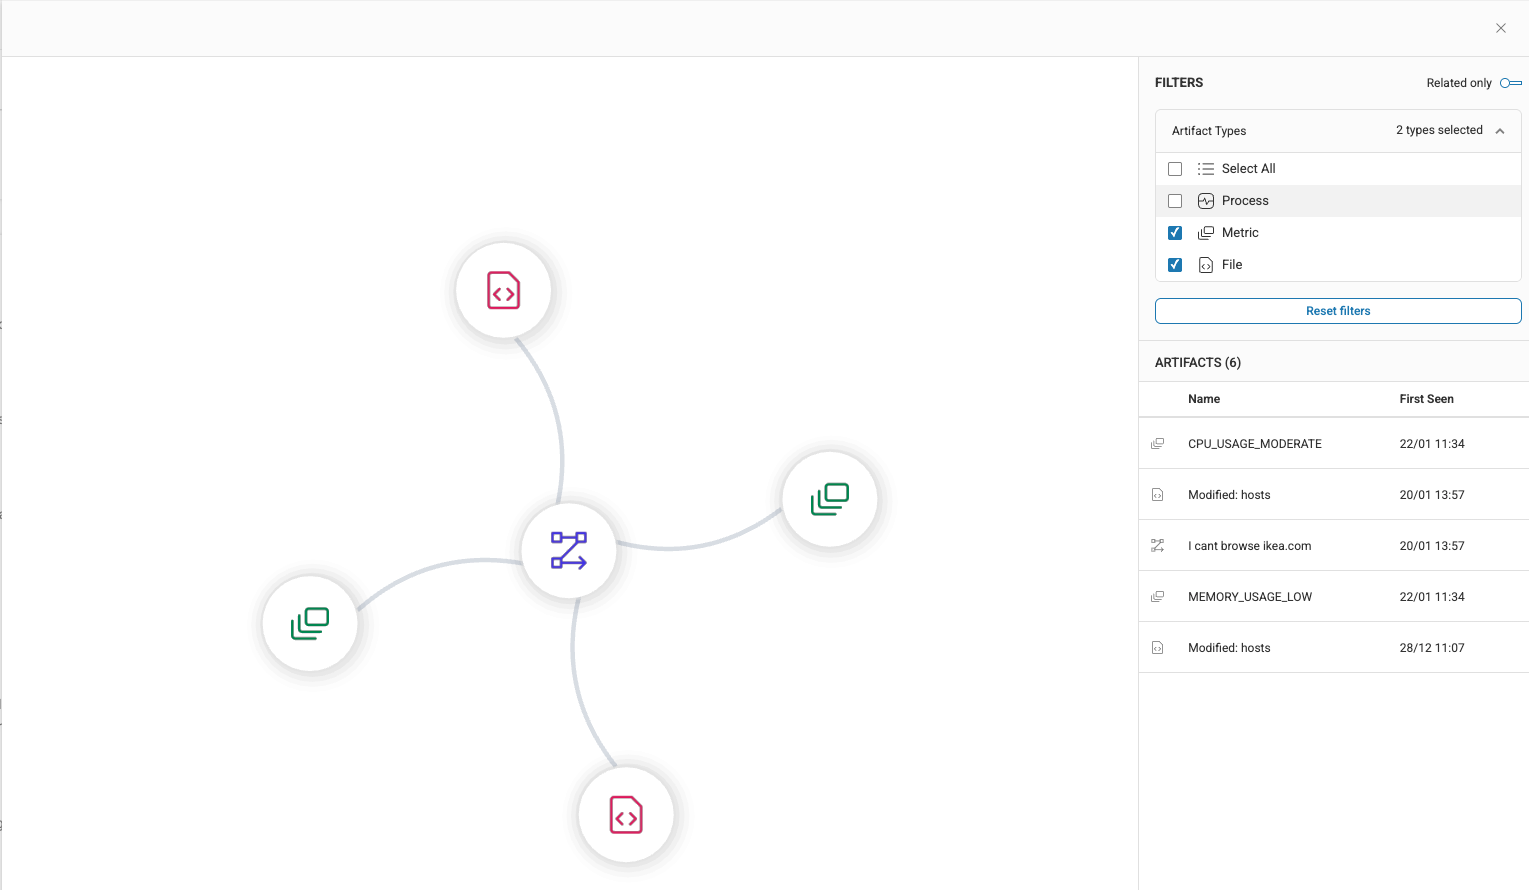
The graph displays the central issue at the core, with connected artifacts branching out from it. This makes it easy to see which elements influenced or contributed to the problem.
Filter Relevant Artifacts
To focus on the data most relevant to your investigation, use the FILTERS panel to narrow the graph to specific artifact types, such as files, processes, or metrics. By default the Related only option at the top is selected to display only those artifacts related to the issue.
Artifact Details
The ARTIFACTS list shows each related artifact, when it was first seen, and its type. Selecting an artifact highlights it in the graph, giving you immediate context and helping you trace dependencies.
Patterns
Pulse automatically learns patterns from investigation outcomes. The Patterns page provides a centralized view of all known issue patterns that Pulse can automatically detect, analyze, and investigate. Each pattern represents a recurring problem type that Pulse has been trained to identify using system signals, diagnostic data, and user‑reported symptoms.
As Pulse learns from your environment, these patterns evolve to continuously improve root‑cause accuracy, reduce noise, and enable faster, automated investigations.
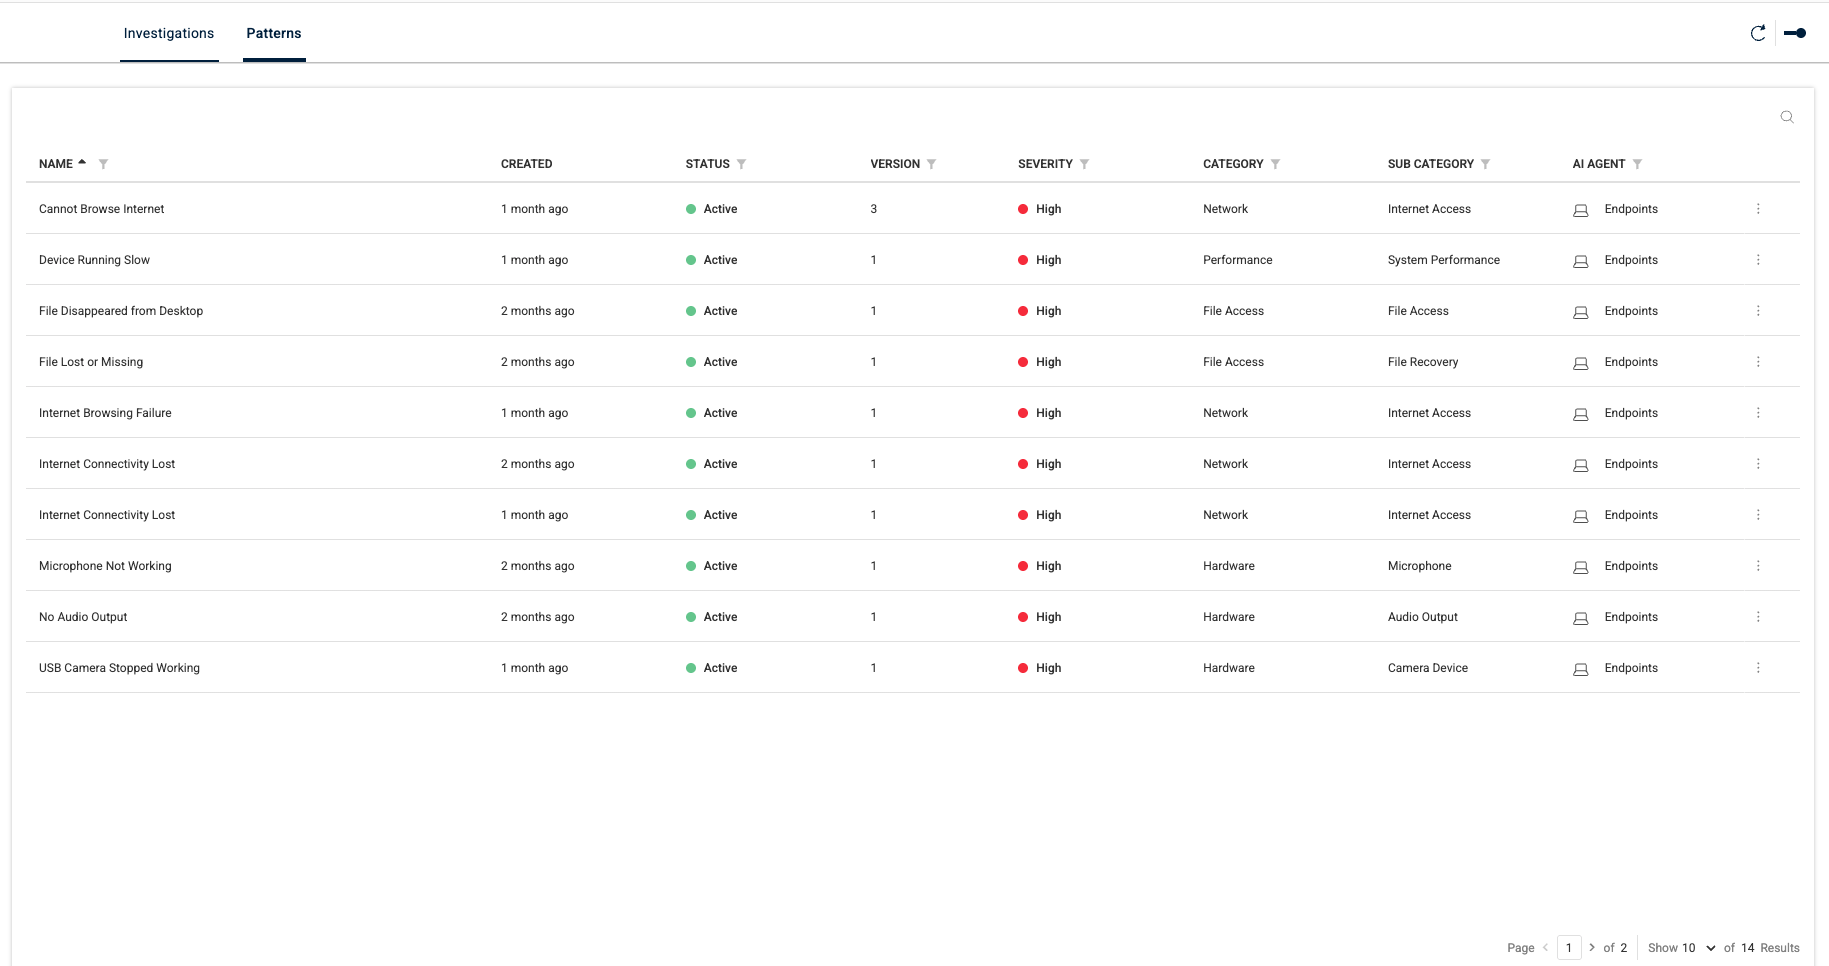
The Patterns page lists every active pattern, including issues such as network connectivity failures, device performance degradation, file access problems, hardware malfunctions, and more. Each pattern row shows essential metadata.
Sort Patterns
Column sorting allows you to quickly find patterns by severity, category, or date. This helps you understand which issues are most critical or commonly observed in your environment.
Pattern Details
To drill down to the details page of a single pattern, click a row.
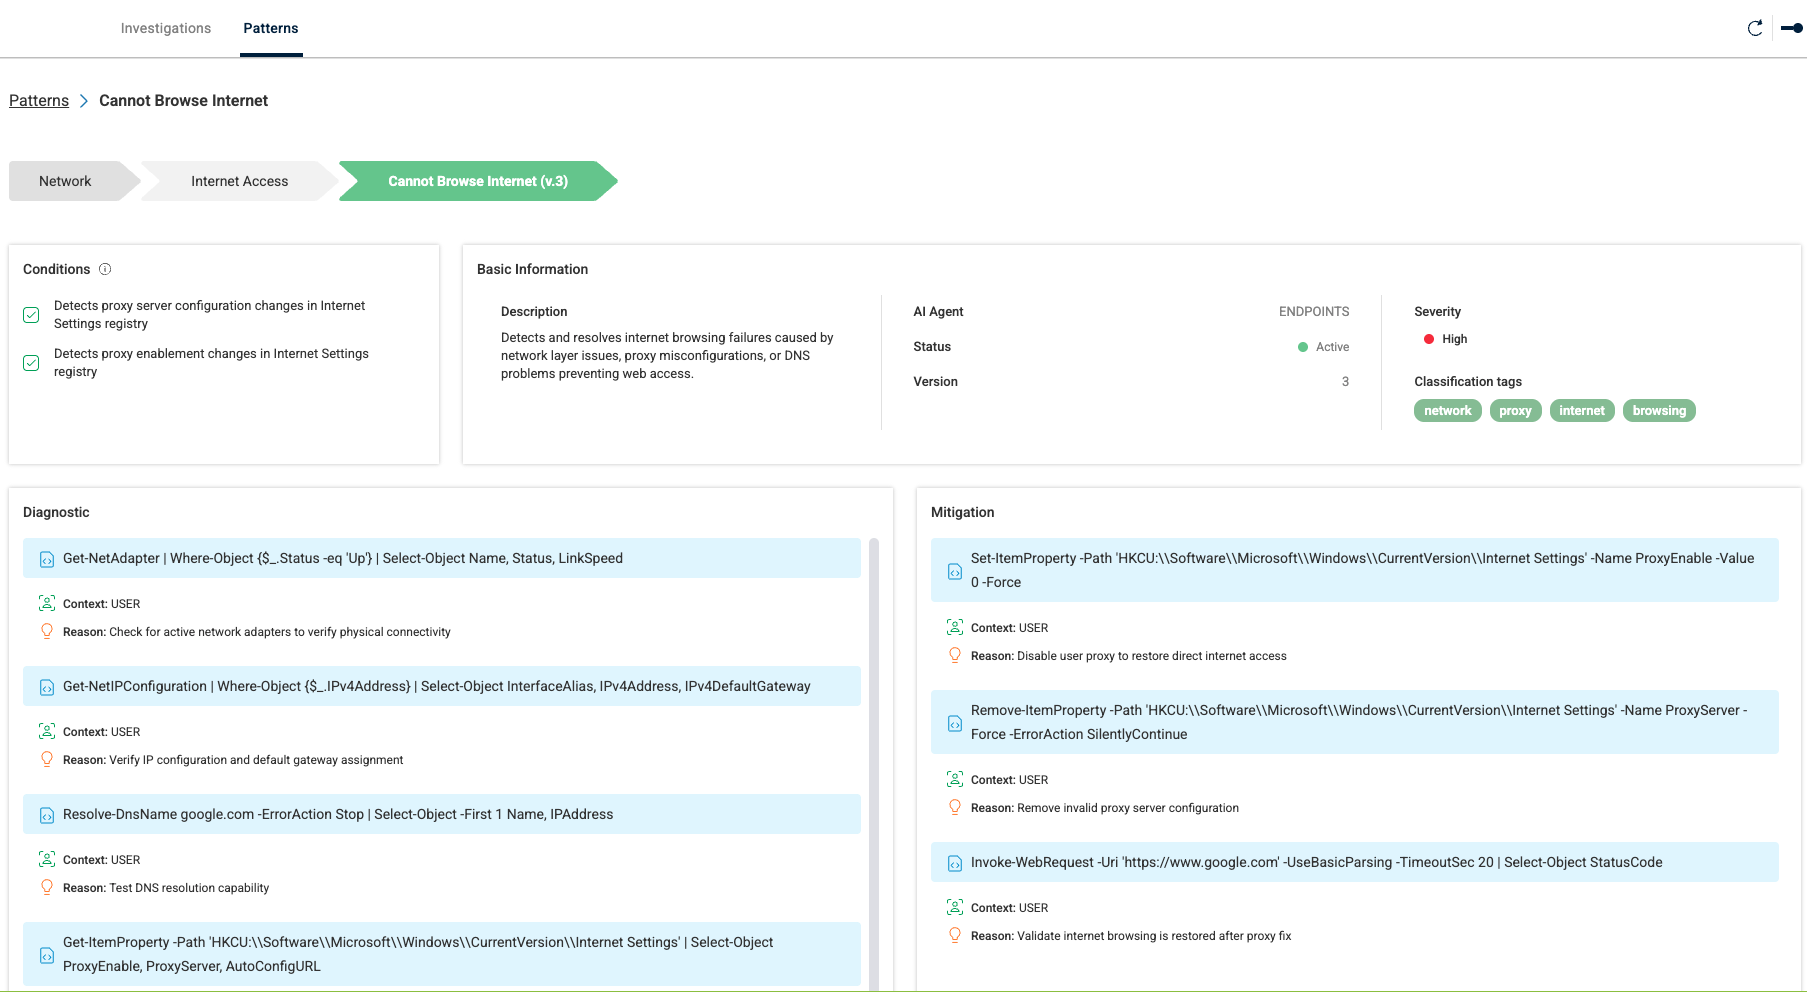
The pattern details page provides a deep look into how Pulse recognizes, investigates, and mitigates a specific issue pattern. It brings together the logic, signals, diagnostics, and remediation steps that define the pattern, helping you understand exactly how Pulse detects and resolves recurring problems in your environment.
Components
At the top of the page, Pulse displays the pattern name and its classification tags (such as network, hardware, or performance). This helps you quickly understand the type of issue the pattern covers—for example, “Internet Access → Cannot Browse Internet.”
Conditions
Conditions outline the triggers Pulse looks for when identifying this issue. These signals may include configuration changes, system events, or registry modifications that commonly cause the problem. This makes it clear what environmental cues led to match this pattern.
Basic Information
This panel summarizes essential details, including:
Description of the issue and how it affects the user
AI Agent responsible for monitoring the pattern
Status of the issue
Version of the pattern logic
Severity indicating how impactful the issue is
Classification tags that group related issues for easier management
Diagnostic
The Diagnostic pane shows the full set of checks Pulse performs when this pattern is detected. These can include:
Network connectivity tests
DNS and gateway verification
Proxy configuration checks
File or registry validation
Each diagnostic step includes the exact commands or tests that execute, along with the context they examine, providing complete transparency into the issue investigation.
Mitigation
The Mitigation section lists the recommended remediation actions suggested and performed for the pattern. Each action includes:
The command or step executed
The reason the action is useful or necessary
The expected outcome
This helps admins understand what was, or should be, done and why, enabling informed decision‑making when approving risk‑based remediation.