You can view Detailed Network Drive metrics in the VDI App and Real-Time DX Console. You can use this feature to display a detailed view of your mapped Windows network drives data metrics by using the Disks view in the VDI App and the out-of-the-box Detailed Network Drive Info column preset in the Console.
The following article explains how to use this feature to more efficiently monitor the status of your network drives.
ControlUp Agent
ControlUp Agents automatically detect the network drives of user sessions in your organization and monitor key metrics of their logical disks. The cuAgentHelper is a helper process that runs in a user session and enables the agent to detect the network drives of a managed machine. This process is related to our Active Application feature.
By default, the Detailed Network Drive metrics feature is disabled. To enable the feature, you must use the registry settings below per agent.
Enable Network Drive Metrics
To enable Detailed Network Drive metrics, perform the following steps:
- On the machine running the ControlUp Agent, open the Registry Editor.
- Under HKLM\SOFTWARE\Smart-X\ControlUp\Agent, create a new DWORD value called NetworkDriveHelperEnable. Set the value data as 1 and click OK.
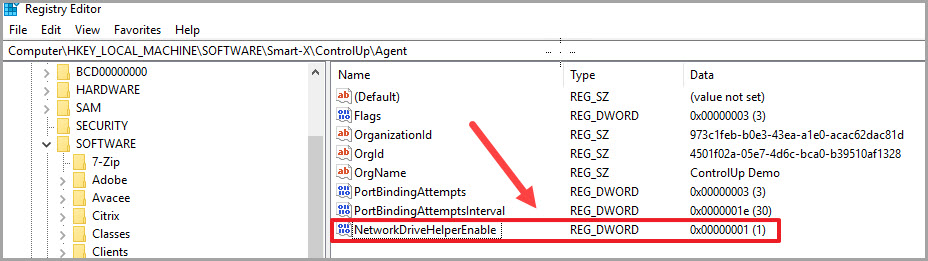
- Restart the ControlUp Agent service (cuAgent.exe) once for this change to take effect.
After you restart the agent, the feature is fully enabled for you to view your detailed network drives metrics.
Monitor Network Drive Metrics
Use the following Detailed Network Drive metrics to monitor the details and data of each logical disk:
| Column | Description |
|---|---|
| Disk Name | Name of each logical disk drive. |
| Machine | Name of the machine containing each disk. |
| Session ID | ID number of the user session that the network drive is mapped to. |
| User Name | User name of the user connected to the session. |
| Capacity | Total storage capacity (GB) of the disk. |
| Free Space | Total amount of free space (GB) available on the disk. |
| % Free Space | Percentage of free space available on the disk. |
| File System Path | Path of the file system on the machine containing the disk. |
You can use these metrics to monitor the status of your network drives and to compare between the total capacity and disk space that each drive is consuming. With the insights you draw from this data, you can identify trends about network health and application usage. Use the detailed network drive metrics to take actions to improve system functionality and the user experiences throughout your organization.
Detailed Network Drive Info in the VDI App
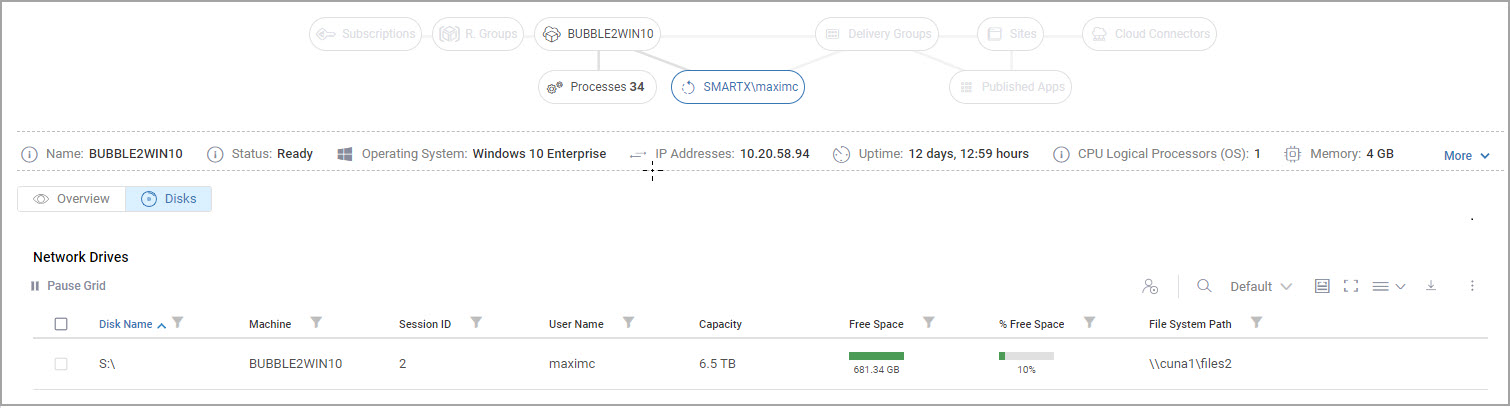
You can view detailed information for the mapped Windows network drives of your managed machines in the VDI App if you drill down to specific sessions.
To view the network drives metrics:
- In the Topology view, click User Sessions, then select a user session.
- Click the Disks tab to display the network drive details:
Disks Views
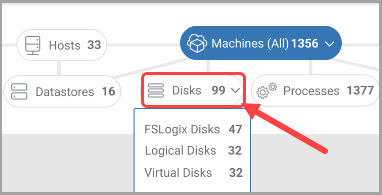
You can track the usage of your logical, virtual and FSLogix disks in the topology Disks views. This feature offers you holistic views of your disks over time, without opening the Real-Time DX Console.
To open a Disks view: In the topology, click Disks, then select the relevant view to drilldown to.
Detailed Network Drive Info in the Real-Time Console
You can also view detailed information for the mapped Windows network drives of your managed machines in the Real-Time Console.
To view the Network Drives Columns:
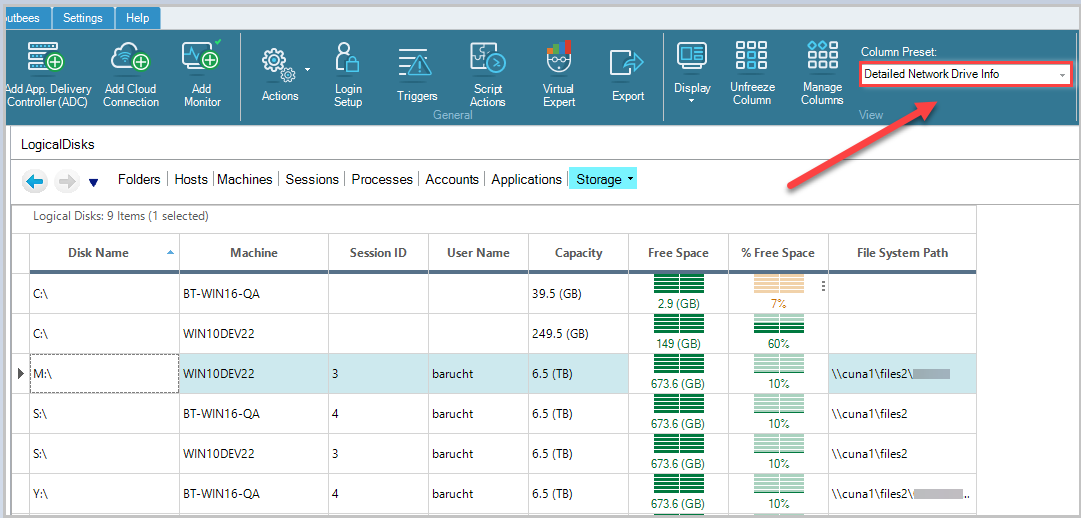
- Double-click on a folder in your organization tree to display the machines containing the virtual drives that you want to monitor.
- Select the Storage view on the Information Grid, then select Detailed Network Drive Info from the Column Preset drop-down to display the network drive details:
Presets auto-save any changes you make while the preset is selected. If you change columns or filters while viewing a certain preset, the preset is updated with the changes you make.
When you connect to a mapped network drive, the drive appears in the Storage view.
If you disconnect from a mapped network drive, the drive disappears from the Storage view, but the ControlUp Agent will continue to send the logical disk data to the console.
Adding Triggers for Network Drives
You can also add both advanced and scheduled triggers for your network drives. Use network drive triggers to configure the follow-up actions for incidents that occur when your logical disk metrics cross the thresholds you define.
To create a new trigger for network drives, you must first define the specific Trigger Settings as needed:
-
From the Settings menu, open Trigger Settings > Add Trigger, select Logical Disks from the Record Type drop-down, and click Next.
-
Click Filter editor, select the network drive items from the New Item drop-down to add conditions to, and click OK:
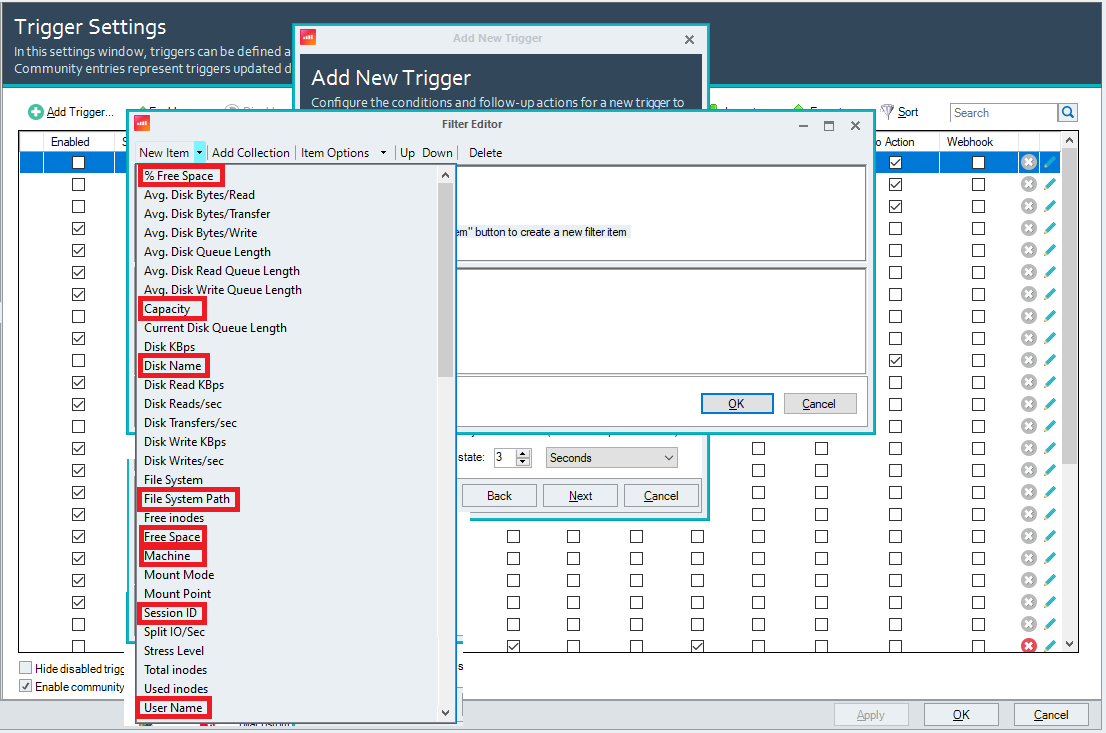
-
Select attributes, rules, and values to add to the conditions as needed.
For more information about triggers, see Setting up Triggers.