The “Top Insights” page is intended to summarize the key findings regarding the state of your monitored resources by means of showing information tiles we’ll call insights. The insights shown in this page are powered by a nightly search that scans all the activity recorded by ControlUp in your environment during the previous day.
The insights shown on this page provide answers to questions such as:
How many sessions were there yesterday?
How is the daily session count different from the normal trend?
On what servers there’s a critical free disk space problem?
Were there any new applications running on the monitored computers?
Who were the top CPU consuming users?
The following additional functionality is offered:
Clicking on any insight will lead to the relevant report, showing more details. By default, the target reports will focus on the previous day.
For example, clicking on the following insight:

Will switch to the Sessions Activity report showing all user sessions established on your monitored computers yesterday
Some insights will display a trend indicator which compares yesterday’s data to the average measurement obtained in your organization on the same weekday during the last 5 weeks.
For example, the following indicator shown on Tuesday:

Means that Monday’s measurement was 57% higher than the average of the last five Mondays.
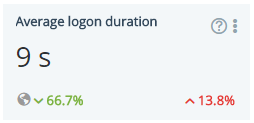
Some insights will display a trend indicator which compares yesterday’s data to the global average.
For example, the following indicator in the Average Logon Duration

Means that yesterday’s average is <X> percents higher than the global average logon duration.
Some insights will only appear when a specific condition is detected in your organization, for example when a new application is detected. If the same condition is not detected on the following day, the insight will not appear.
Insights can be rearranged so that the more relevant tiles are displayed on top
Insights that are irrelevant or of little value can be minimized by clicking on the upper right hand side
