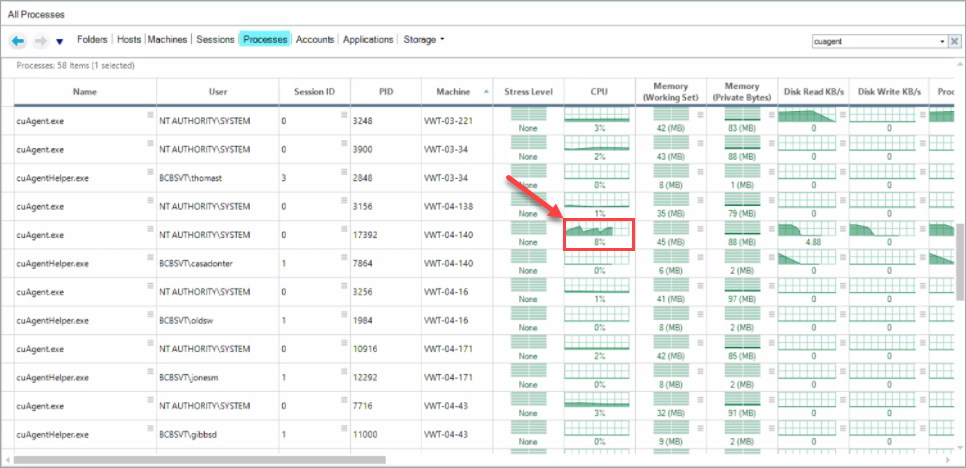
The ControlUp Agent normally consumes 1%-2% of CPU resources and up to 200MB of RAM. If the ControlUp Agent service is consuming more resources in your environment, use the following article to determine the possible causes.
Root Cause Analysis
Use the following section to determine a root cause for high resource consumption of the ControlUp Agent process.
The Root Cause Analysis section isn't intended to be exhaustive, rather it provides a good starting point to determine root causes.
Adjust the Data Collection Interval for Processes
We recommend tuning the process data collection interval from the default 3 seconds to a higher interval on endpoints with a high number of processes (over 200), and a lower number of CPU cores (less than 4).
You can also specify the collection interval for processes that run on machines with the ControlUp Agent installed by using the following registry setting:
Registry Key: HKLM\SOFTWARE\Smart-X\ControlUp\Agent
Value: ProcessesCollectionInterval
Base: Decimal
Data Type: REG_DWORD
Value Data: Any integer in seconds
To reduce the CPU usage of the ControlUp Agent process, we recommend that you increase the data value of ProcessesCollectionInterval. Start first with a value of 30 seconds to check the impact on the CPU usage.
By default, ControlUp refreshes data every 3 seconds, even if the registry key doesn't exist.
The ProcessesCollectionIntervalvalue only affects process metrics. All other machine and session metrics use the default collection interval of 3 seconds.
ControlUp Agent Used as Data Collector
Every ControlUp Data Collector serves as a ControlUp Agent, but not all ControlUp Agents are Data Collectors. In general, agents running on Data Collector machines consume more CPU and RAM resources than agents running on non-Data Collector machines.
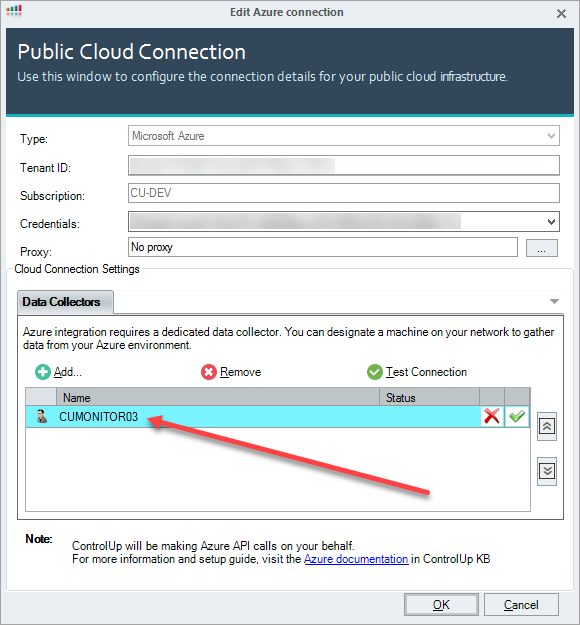
If the machine with the high resource-consuming ControlUp Agent process is configured as a Data Collector, you might resolve the performance issue by adding hardware resources to the specific machine. To learn more about Data Collectors, see ControlUp Data Collector.
ControlUp extension types that show the Data Collector include Citrix CVAD, Omnissa Horizon (formerly VMware Horizon), VMware vCenter, and Microsoft Azure. Right-click a extension and select Properties to show if a managed machine running the ControlUp Agent also serves as a Data Collector.
Disable Logon Duration Feature
There were past instances when the ETW Logon Duration module used high CPU/RAM resources, especially on machines with the McAfee Agent installed. Although this instance hasn't been observed in recent ControlUp versions, you can investigate it as a possible root cause.
If you can rule out the module as a root cause, disable the Logon Duration feature by using the following registry setting:
Registry Key: HKLM\SOFTWARE\Smart-X\ControlUp\Agent
Value: EnableLogonDuration
Data Type: REG_DWORD
Value Data: 0 (Disabled), 1 (Enabled)
After you set the key, restart the ControlUp Agent service.
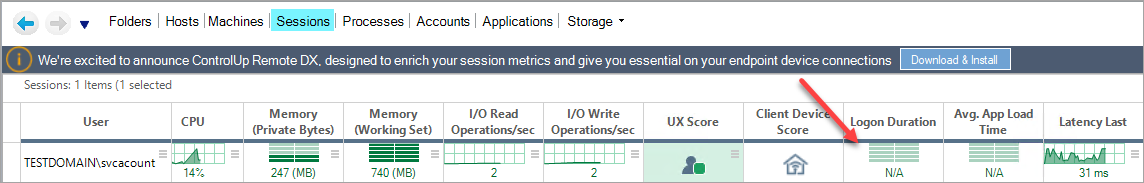
Verify that **Logon Duration ** is disabled by establishing a new session on the agent machine. N/A will appear under the Logon Duration column for the session.
Disable AppLoadTime Feature
The** Application Load Time** feature measures the time it takes for each application to become available to the user. You can disable this feature on the specific agent machine by using the following registry setting:
Registry Key: HKLM\SOFTWARE\Smart-X\ControlUp\Agent\AppLoadTime
Value: EnableMeasurement
Data Type: REG_DWORD
Value Data: 0 (Disabled), 1(Enabled)
After you set this registry key, restart the ControlUp Agent service.
Restore Performance Counter Settings
Performance counters may be missing or corrupted. There were past instances when corrupted performance counters led to high CPU consumption of the ControlUp Agent process. If performance counters are corrupted on your agent machine, try to synchronize the registered counters with the configuration database.
To restore performance counter settings, open a command prompt window as an administrator and run the command lodctr /R. After you run the command, restart your machine.
To learn more about rebuilding performance counters, see Manually rebuild performance counter library values.
Repair the WMI Repository
To perform a consistency check on the WMI repository, open a command prompt window as an administrator and run the command winmgmt /verifyrepository.
If the WMI repository is corrupted, you must rebuild the repository. Run the command winmgmt /salvagerepository. After you run the command, restart Windows on your machine.
Disable Browser URL / Active Application Title Feature
To disable the Active Application Title feature, click Settings > Active Application and deselect the Show Active Application Title checkbox.
Provide a Memory Dump and Trace File
You can provide our support team with a memory dump and trace file of the ControlUp Agent process. Follow the instructions below to learn how to generate a memory dump and trace file.
Create both the memory dump and trace files during the time when the performance issue occurs.
Generate a Memory Dump
A memory dump is a file that saves the memory state of a process on your machine. To create a memory dump, open Task Manager, right-click cuAgent.exe, and select Create dump file.
After you create the .dmp file, send it to us at support@controlup.com.
Generate a Trace File
Another advanced technique to identify performance bottlenecks is to create a trace file with the JetBrains dotTrace tool. This is especially useful when you investigate CPU-related issues. To learn about using dotTrace, see Create a Snapshot File of ControlUp Components with dotTrace.
After you create the trace file, send it to us at support@controlup.com.