Many features on the Users page are available only if you have set up User Risk Analytics.
The Users tab shows you an overview of security risk from the perspective of individual users.
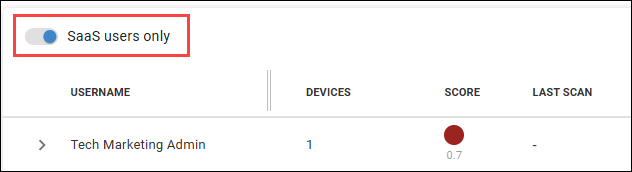
SaaS users vs. Console users
By default, the SaaS users only toggle is enabled and the page displays data only from SaaS users. These are users who have been identified from a SaaS application login through the User Risk Analytics feature. If you haven't set up User Risk Analytics, then the page displays no users when the toggle is enabled.
If you disable the SaaS users only toggle, the page displays all SaaS users and the Console user for each device. In some cases, an individual employee can appear in the table more than once (the Console user for their device, and the account used to sign into SaaS apps).
The SaaS user is more likely to uniquely and accurately identify a user. In most cases, we recommend that you leave the SaaS users only toggle enabled, if you have set up the User Risk Analytics feature.
Widget descriptions
- Devices Used for SaaS App/VPN Logins. Shows you how many devices are used for SaaS app logins, broken down by whether the device is covered by ControlUp for Compliance.
- Work on Compliant Device. The number of users working on devices that are compliant vs. non-compliant. A device is considiered compliant if the Understanding Score and Severity is 8 or higher.
- Logins by Authentication Method. The total number of app logins, broken down by the authentication method.
- User risk by score. The number of users in each risk level category. The risk is determined by the user's score. Understanding Score and Severity.
- User logins categorized by severity over time. Shows the number of SaaS app logins over time with the level of risk for each login.
View a list of all users
The table below the widgets lists all users in your environment. If a user has multiple devices, you can expand the row to see details from all devices.
Column descriptions
The following information is displayed for each user's device:
- Devices. The number of devices used by the user. If the number of devices is greater than 1, click the arrow icon to expand the row and see details from each device.
- Score. The user's score. Understanding Score and Severity.
- Last Scan. The time since the user's device was last scanned by ControlUp for Compliance.
- Admin Rights. Whether the user is a Windows Administrator on their device.
- Location. The location of the device reported by ControlUp for Desktops. Learn more about device geolocation.
- IP. The device's IP address.
- Issues. Hover over the chart to see the number of issues detected on the user's device, broken down by issue severity.
- Auth source. The authentication method used to sign into the last used SaaS app on the device.
- App. The last used SaaS app on the device.
- Certification strength. The strength of the application's regulatory certifications, based on the number of certifications identified. To see the certificates, you can go to the Apps dashboard and select the SaaS tab. Read the Apps dashboard article to learn which certifications are considered.
- None - no certifications
- Fair - 1 certification
- Good - 2 or more certifications
- Compliance. Whether the device has the ControlUp for Compliance Agent installed.
- Edge DX. Whether the device has the ControlUp for Desktops (Edge DX) Agent installed.
- Login risk. The user's level of login risk.
- Login time. The time of the user's last SaaS app login.
See details for a specific user
You can click on a user in the table to drill down into the login details for that user. Read User Risk Analytics for details.