New Reports for Hybrid Cloud Only
New data pipeline reports are available in our web interface at app.controlup.com only if you use ControlUp Hybrid Cloud. If you use ControlUp On-Premises, use Insights On-Premises to view historical data.
You can view new data pipeline reports to identify trends about user activity, system health, and application usage. If your organization previously used legacy reports before we closed our old data connection, you can still view them in the web interface.
For an overview of our report functionalities, watch our video.
Use our new data pipeline reports to analyze real-time VDI and DaaS data in your environment, with increased visibility into your metrics, faster. Data pipeline reports reduce the time that it takes for aggregated data to display in widgets and charts. Your data is ready to view from a few seconds to about 2 minutes after the data is retrieved by ControlUp Monitors. By streamlining our data integration process, data pipeline reports support higher data resolution for large-scale organizations.
With our data pipeline reports, you get dozens of new metrics, 5 minute data collection intervals, and new aggregation methods such as P100 and P95. Use the data from the report metrics to take actions to optimize your environment, and improve system functionality and the user experiences throughout your organization. Our new data pipeline enhancements provide valuable insights at a higher frequency and with greater visibility than historical data.
Benefits of the new reporting:
All data accessed within 2-5 minute data collection intervals
Reduced data retrieval time
Increased visibility across data sources
Higher data granularity collected at shorter intervals
Enhanced data forecasting
You can view new data pipeline reports in our web interface (app.controlup.com) to analyze data in your ControlUp environment.
DPA
For any security concerns regarding the new data pipeline and how it is hosted, refer to our DPA.
Prerequisites for new data pipeline reports
Add the respective URL to your allow list based on your region:
https://monitor-receiver-azure-eastus-prod.controlup.com/v1/data
https://monitor-receiver-azure-westeurope-prod.controlup.com/v1/data
http://formatters-prod-eu-east-1.s3.amazonaws.com
https://monitor-receiver-azure-canadacentral-prod.controlup.com
For details on adding URLs, see Communication Ports Used By ControlUp: Hybrid Cloud.
After you complete the prerequisites, it will take us a few days to set up, including migrating your data upload to the new data pipeline. You will be notified by our team once we move your organization and your new reports are ready to view.
Report Access
To access the new data pipeline reports from app.controlup.com, click the Reports icon.
.png)
Permissions for accessing each report are set under the Reports permission category. Learn more about setting permissions.
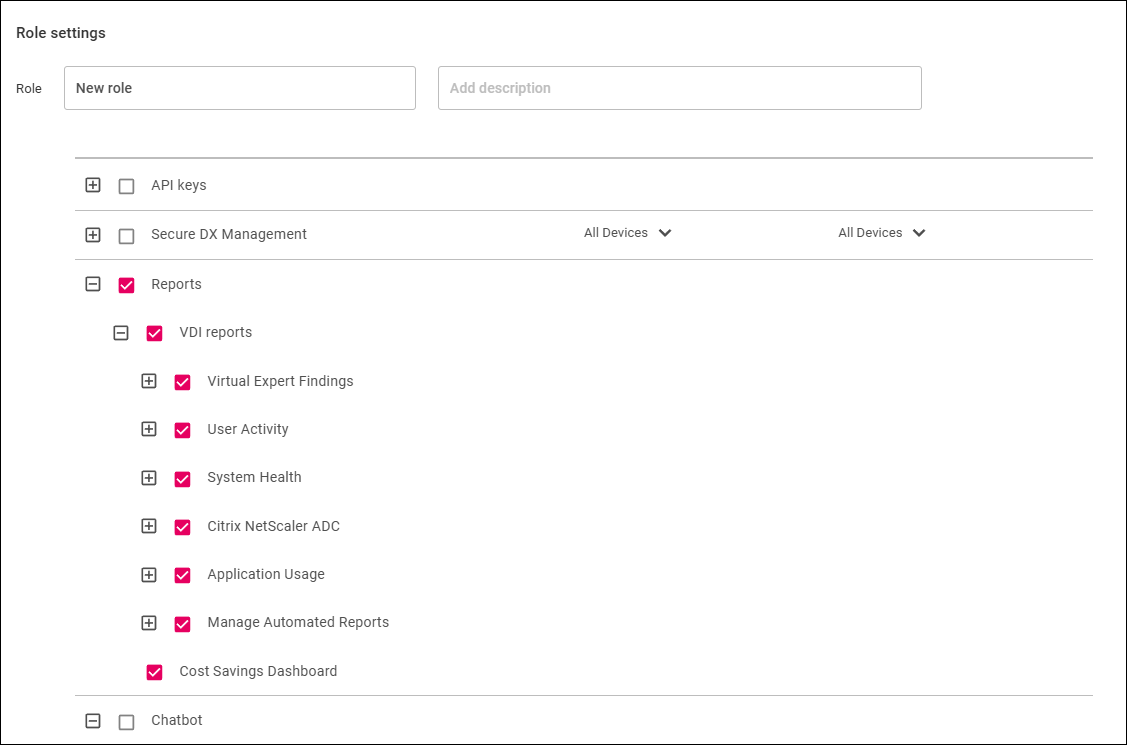
Security limitation with VDI reports permissions
While you can use permissions to block a user's access to specific reports, these restrictions apply only to the UI. If a user has at least one permission from the VDI reports permission category, then that user can access our backend API (not our REST API) to view the raw data for all VDI reports if they have the right technical knowledge.
When using the REST API to access report data, you can access data for a report only if you have permission to view that report.
Time Selection
Data pipeline reports display metrics according to the following time granularity you select:
Time Range | Granularity |
|---|---|
Under 24 hours | 5 minutes |
From 24 hours to 30 days | 1 hour |
Over 30 days | 1 day (UTC 00:00 - 00:00) |
When you access a report, the default time frame displayed is 24H. The maximum data retention period is 1 year. If you switch between different reports, the time range you selected is saved and applied to each report, as displayed by the date picker.
To select a custom time frame, click the date picker > Custom, select dates as needed and click Apply.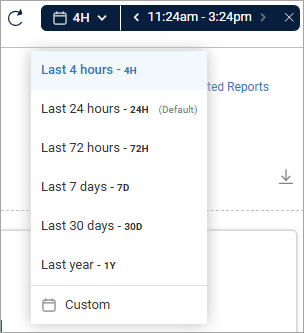
If you select the time as 4H or 24H, you can refresh the report data without refreshing your folder, filter, or sorting selections in the data grid. To refresh report data, click the Refresh Data icon to the left of the date picker.
In a data pipeline report, if you select a time range that includes data prior to when your organization was moved to the new data pipeline (for example, 1Y), a link appears to view data in a legacy report for that time range.
In a legacy report, if you select a time range that includes data from after your organization was moved to the new data pipeline (for example, 4H), a link appears to view data in a data pipeline report for that time range.
Reports Actions
You select reports from the dropdown menu on the Reports view. You can also select which report is the default for the view.
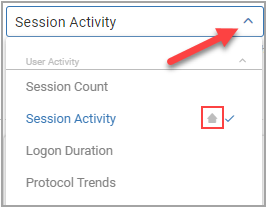
To change the default report:
Select the report from the dropdown.
Click the three dots to the right of the report name.
Click Set as default. The house icon now appears next to the report you selected.
You can set any of the following options to change the metrics displayed in your report:
Time Range. For reports that display time range charts, you can click and drag the mouse across a specific time period on a chart to zoom in on that time period.
Cursor Follower. To simultaneously display the metrics from all of the widgets in a report on the popover of each widget, select the Cursor follower. Use this feature to quickly compare multiple metrics on the data points of a widget without moving your cursor to other widgets.
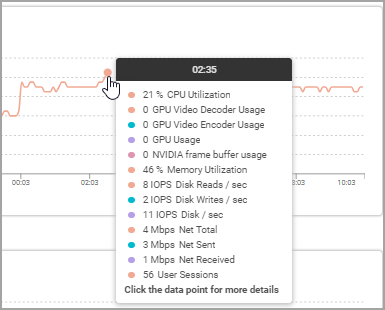
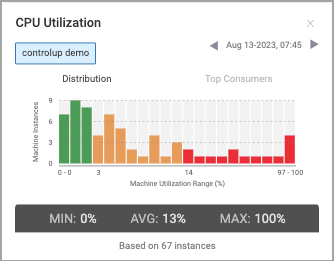
Top Consumers and Distribution. You can toggle between the Top Consumers list and the Distribution graph (Utilization Range) for each data point, and view values for earlier or later data points by clicking the arrows next to the timestamp.
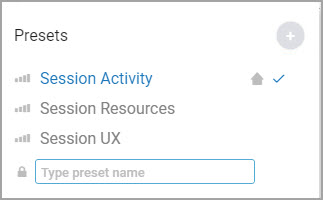
Presets. Depending on what kind of information you want to view, you can select from the out-of-the-box presets already created for the report. For example, the Session Activity historical report includes presets for:
Session Activity. Shows all session data.
Session Resources. Shows the resource usage of the session.
Session UX. Shows data about how the session performed for the end user.
Custom Presets
You can also create your own custom presets to include additional columns to display, with the filters and time range you apply when you work in your custom preset. When you view a report with a custom preset selected, any changes you make are saved to the preset.
For example, if you create a preset and add a filter, that filter is saved to the preset. The next time you select to view that preset, the same filter is applied.
For more information about presets, see Column Presets.
Column Picker
The column picker works the same as in the Discovery grid, and enables you to select which columns to view from the available columns for each report.
Export Report
You can export data from widgets and grids. To download the data as a CSV or PDF file, click the Export report icon on the top right of the report page or grid.
Send Automated Reports
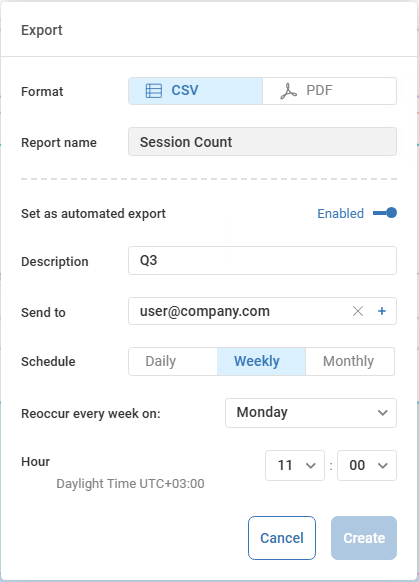
You can also export the data as an Automated Report and automatically send it to selected email recipients, in both CSV format and PDF formats for selected reports. To export an Automated Report, you must be assigned both the Manage Personal Automated Reports and the Manage All Automated reports permissions.
To set the report as automated and send it via email:
In the Export popup, enable Set as Automated Report.
Add email recipient(s) to the Send to list as needed.
Set the Schedule, Reoccur date if relevant, and Hour to send the automated report.
Click Create.
To edit, delete, or disable the automated report set from the web interface, click the Automated Reports icon  next to the report name on the top of the screen.
Data Pipeline Report Details
You can view the following data pipeline reports. The list includes details of the new enhancements for each report that are available to view only from new data pipeline reports:
Virtual Expert Findings
Sizing Recommendations. Displays historical information that enables you to optimize resource allocations for monitored machines. You can view the machine data according to Virtualization or Azure cost analysis modes:
Virtualization. Displays aggregate data calculations based on CPU and RAM usage data.
Azure cost analysis. Generates a report to understand how to reduce your Azure compute costs.
Note
8 days after your organization migrated to the new data pipeline, data will be displayed in the Sizing Recommendations report.
Environment Assessment. Displays a summary of resource consumption in your environment to identify problematic usage trends. Displays aggregated resource usage data and activity trends from the past 30 days, updated to the minute that the report is generated.
Note
30 days after your organization migrated to the new data pipeline, data will be displayed in the Environment Assessment report.
User Activity Reports
Session Activity. Includes new columns and column presets to display additional session activity data on the grid.
Session Count. Displays additional machines count data series.
Logon Duration. Displays the distribution of logon duration metrics for each logon phase.
Protocol Trends. Displays protocol trends data in additional protocol view.
System Health Reports
Machine Trends. Includes additional GPU Utilization chart.
Machine Statistics. Includes new columns and column presets to display additional machine statistics data on the grid.
Host Trends. Displays resource consumption trends for virtualization hosts by summarizing the performance metrics for different hosts over time.
Host Statistics. Includes new columns to display additional host statistics data on the grid.
Top Windows Errors. Displays the rate of Windows errors recorded on machines in your organization and how these errors were distributed throughout the month you select.
Netscaler ADC Reports
NetScaler. Includes new column to display additional NetScaler appliance data on the grid.
Load Balancing. Displays the historical activity, performance and health of NetScaler Load Balancing appliances in your organization.
Gateway. Displays the historical activity, performance and health of NetScaler Gateway appliances in your organization.
Licensing
Citrix License Usage. Displays the usage statistics of Citrix licenses in your organization.
Application Reports
App Statistics. Displays application statistics data in additional monthly view. Includes new columns to display additional data on the grid.
App Usage Details. Displays application usage details for multiple applications. Displays additional group usage details by user or by machine.
App Trends. Includes additional GPU Utilization, Disk Utilization, and Network Utilization charts.
Published App Usage Details. Displays application usage details for multiple published applications.
Known Issues
We are currently working to resolve the following reporting known issues:
If a monitor resets, "initial" metrics (e.g. initial branch name, initial client name, initial IP address) might display incorrect data.
In the Environment Assessment report, the widgets display an incorrect number of EUC sites.
Legacy Reports
If your organization used legacy reports before moving to our new data pipeline, you will still be to view them for a year from the date when your organization was migrated. The legacy reports might not include all the widgets and features of the new report format.