The following content applies only if you use ControlUp On-Premises. If you use ControlUp Hybrid Cloud, see VDI and DaaS Reports.
To view historical report data, you can use Insights On-Premises.
Report Access
To access the reports from Solve, click the Reports icon.

You can also drilldown to reports from the Discovery view:
- In a topology widget or grid column that you want to view a report for, click the clock icon.

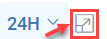
- Select the time frame to view data for from the dropdown (by default, 24H) and click the arrow icon.
Reports Actions
You select reports from the dropdown menu on the Reports view. You can also select which report is the default for the view.
To change the default report:
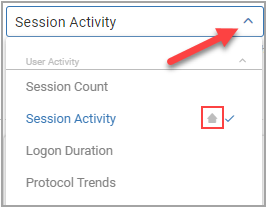
- Select the report from the dropdown.
- Click the three dots to the right of the report name.
- Click Set as default. The house icon now appears next to the report you selected.
You can set any of the following options to change the metrics displayed in your report:
-
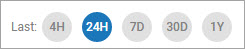
Time Range. In the upper right-hand corner of the page, select from the time period options available for the report. For most reports, the options range from the most previous 4 hours to 1 year.
For reports that display time range charts, you can click and drag the mouse across a specific time period on a chart to zoom in on that time period.
-
Presets. Depending on what kind of information you want to view, you can select from the out-of-the-box presets already created for the report. For example, the Session Activity historical report includes presets for:
- Session Activity. Shows all session data.
- Session Resources. Shows the resource usage of the session.
- Session UX. Shows data about how the session performed for the end user.
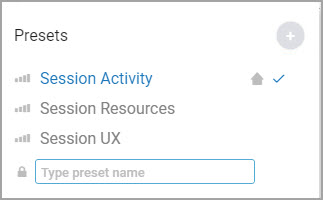
Custom Presets
You can also create your own custom presets to include additional columns to display, with the filters and time range you apply when you work in your custom preset. When you view a report with a custom preset selected, any changes you make are saved to the preset.
For example, if you create a preset and add a filter, that filter is saved to the preset. The next time you select to view that preset, the same filter is applied.
For more information about presets, see Column Presets.
Column Picker
The column picker works the same as in the Discovery grid, and enables you to select which columns to view from the available columns for each report.
Export Report
You can export data from widgets and grids. To download the data as a CSV or PDF file, click the Export report icon on the top right of the report page or grid.
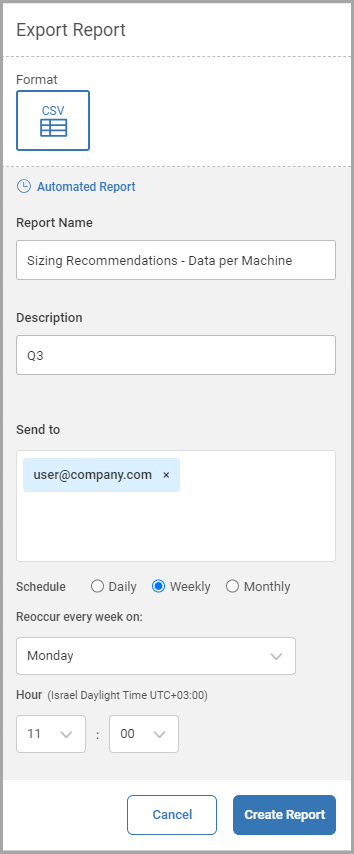
You can also export the data as an automated report and automatically send it to selected email recipients, in both CSV format and PDF formats for selected reports.
To set the report as automated and send it via email: In the Export Report dialog box, click Set as Automated Report. Add email recipient(s) to the Send to list as needed, and set the Schedule and Hour to send the automated report.
To edit, delete, or disable the automated report set from Solve, click Settings.
Report Details
You can view the following reports. Some on-premises report details appear differently from the new data pipeline reports (available only for Hybrid Cloud environments).