Performance Optimization for Real-Time Console & Monitor
-
Print
-
DarkLight
-
PDF
Performance Optimization for Real-Time Console & Monitor
-
Print
-
DarkLight
-
PDF
Article Summary
Share feedback
Thanks for sharing your feedback!
A properly performing ControlUp Monitor and Real-Time Console are essential tools for every ControlUp user to monitor and manage their organization. The following article explains how best to optimize ControlUp settings to avoid performance issues.
The table below describes the optimization settings and the ControlUp components affected:
Optimization Name | Real-Time Console | ControlUp Monitor |
| Process Data Collection (from version 8.8.0.1021 and higher) | ✓ | ✓ |
✓ |
| |
✓ | ✓ | |
✓ | ✓ | |
✓ | ✓ | |
| ✓ | |
✓ |
| |
✓ |
| |
✓ |
1. Disable Process-Level Dependent Views
By default, the console includes the following views: Folders, Hosts, Machines, Sessions, Processes, Accounts, Applications, Storage and App. Delivery Controllers. A high number of total processes running on all monitored resources displayed by the Processes view might cause high resource consumption in large environments.
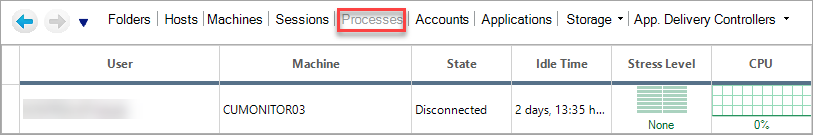
If you experience such a case, it is recommended to disable the Processes tab. Even if the tab is grayed out, you can double-click any user session or machine to view the Processes tab.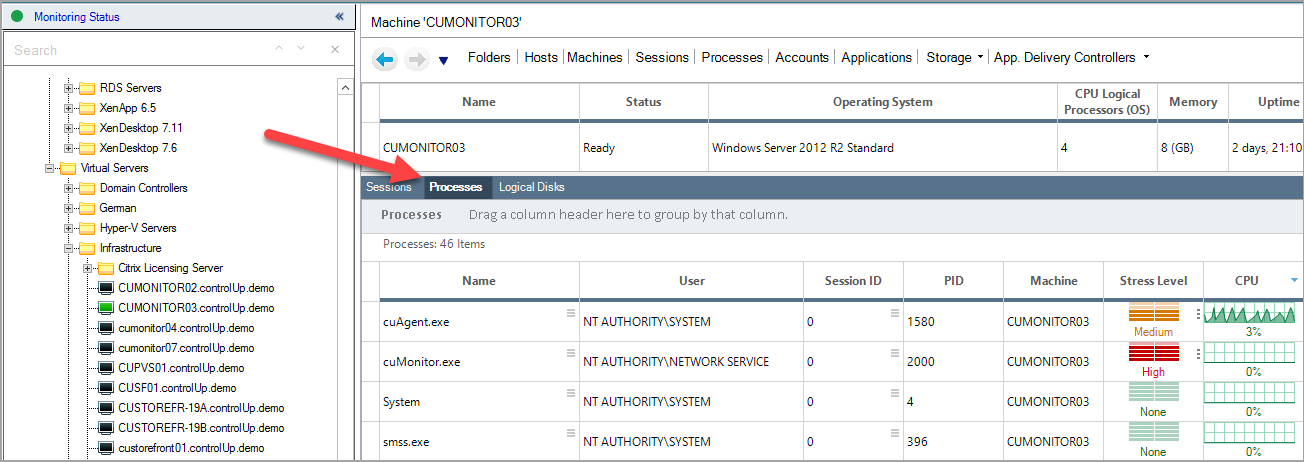
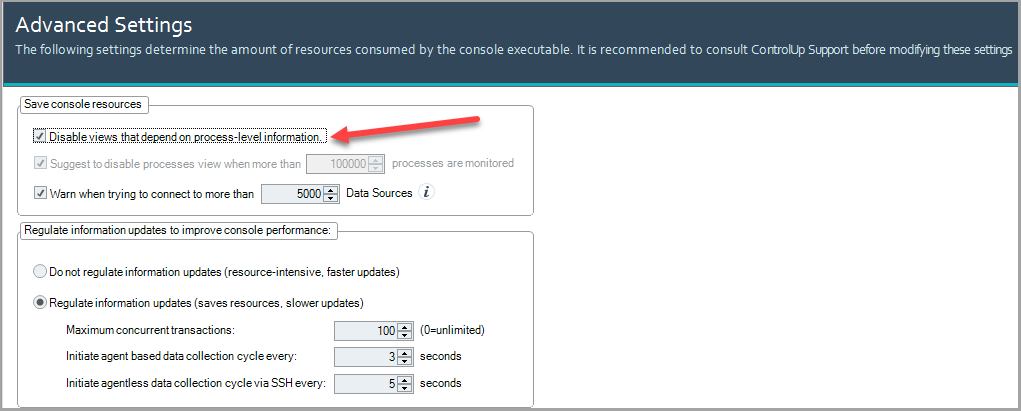
To disable process-level views, click Settings > Advanced and select the Disable views that depend on process-level information checkbox.
2. Increase the Data Collection Interval
By default, every three seconds the console refreshes with real-time metrics received from the ControlUp Agents.
You can configure the data collection interval with the following ways:
- In the console, click Settings > Advanced. You can modify the data collection interval for Windows machines (agent-based collection) or Linux machines (agentless data collection).
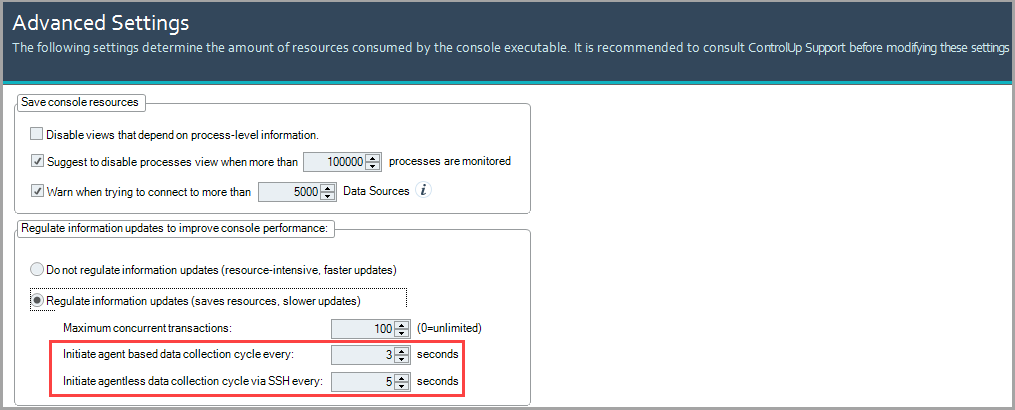
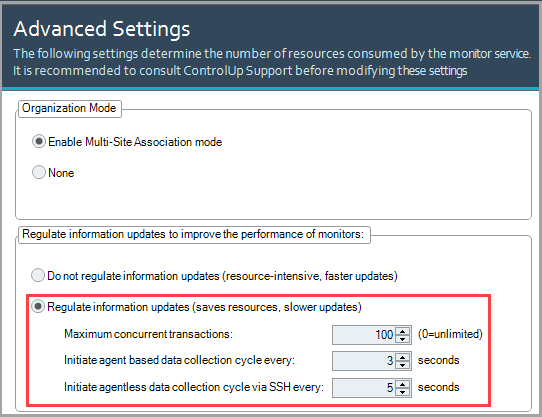
- To update the collection intervals of the monitors, click Monitors > Monitors Settings > Advanced Settings. Select the the Regulate information updates option and configure the collection intervals of your agents in the fields below.
- From version 8.6.5 and higher, you can set the data collection interval on your machines with the ControlUp Agent installed by using the following registry setting:
Key: HKEY_LOCAL_MACHINE\Software\Smart-X\ControlUp\Agent
Value: ProcessesCollectionInterval
Data Type: REG_DWORD
Value Data: Any integer in seconds
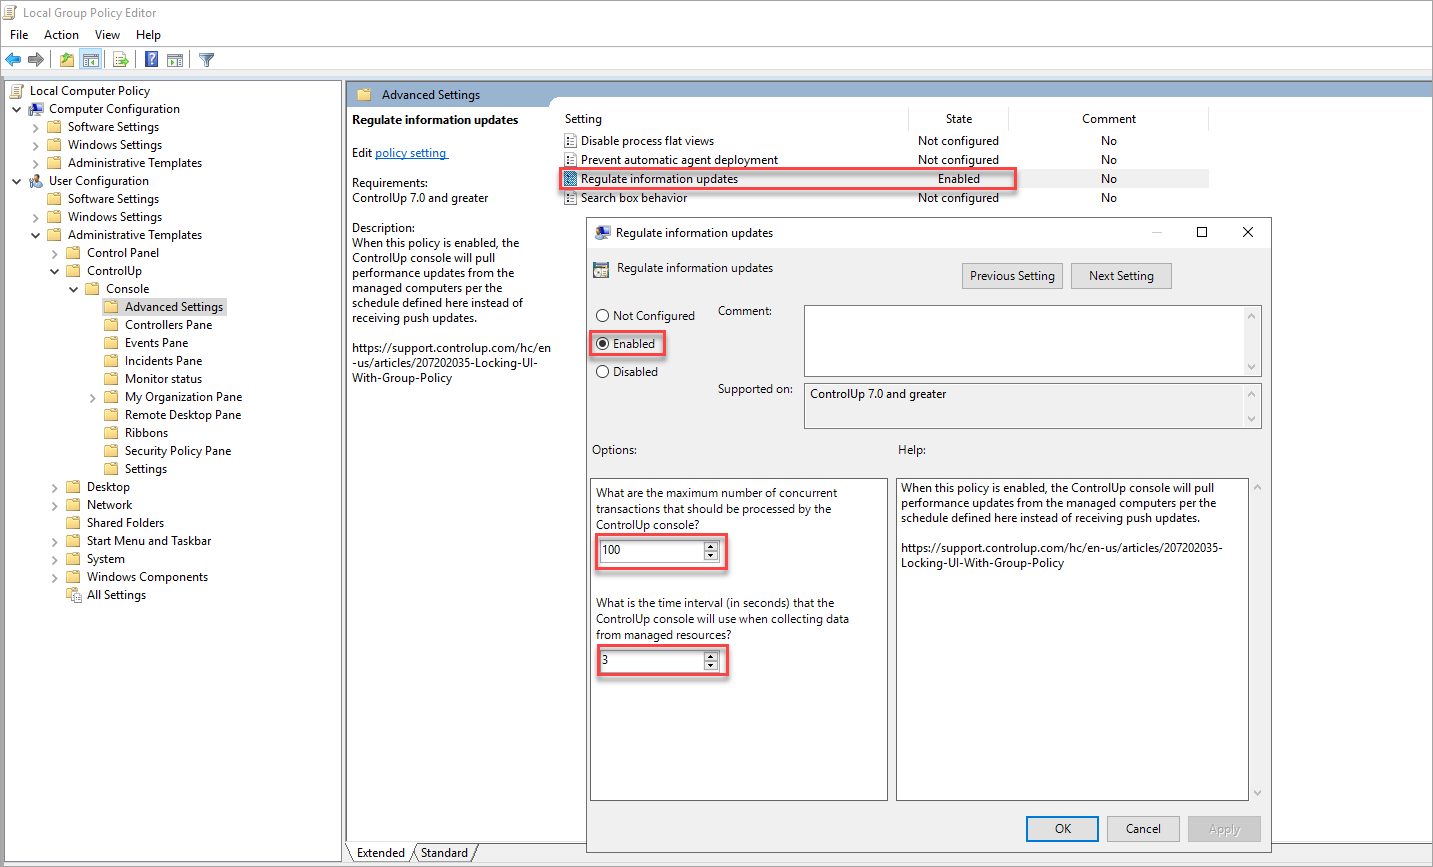
- Use our GPO templates that apply to all console users. For more details on UI management via the group policy, see Locking UI with Group Policy.
3. Set Up a Dedicated Data Collector
A data collector is a machine that collects data from various components, such as hypervisors or EUC environments. We recommend using a dedicated data collector to reduce your performance overhead.
When you set up a hypervisor connection, the console machine is the default data collector. For example, in a large organization with hundreds of consoles connected to hypervisor endpoints, this would greatly impact performance. You can greatly reduce the number of connections to external resources by setting up a dedicated data collector. 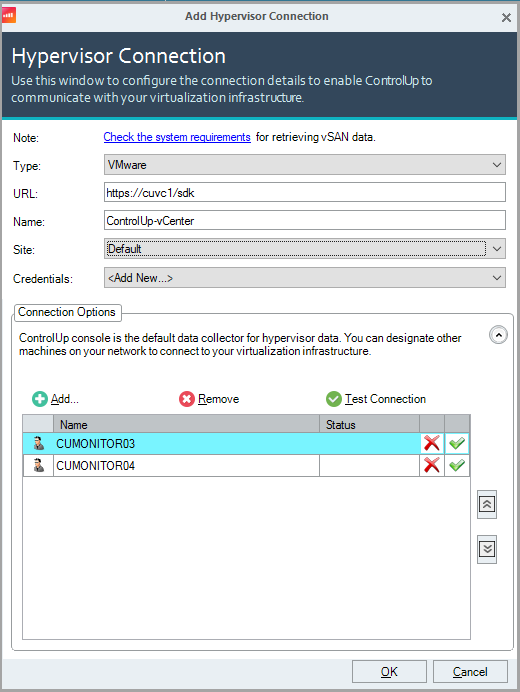
To learn more about data collectors, see ControlUp Data Collector.
4. Optimize Auto Connection Settings
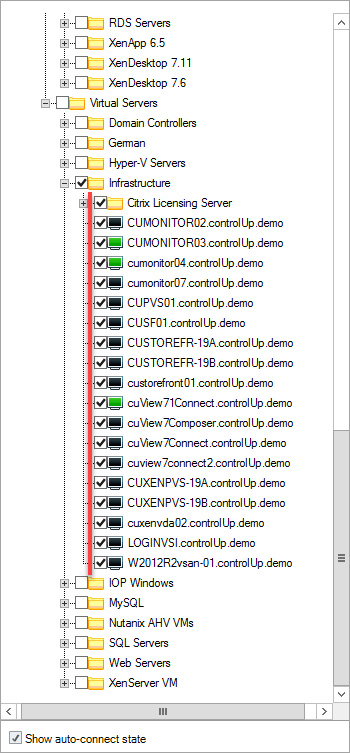
To automate connecting to managed machines from the console, you can select the Show auto-connect state checkbox under your organization tree. You can define machines that you want to automatically connect to, either when the console is started, and/or after a specific time interval that you define in the Agent Settings.
To configure a reconnect interval, click Settings > Agent and configure a value (in minutes) under the Reconnect to machines automatically every option. 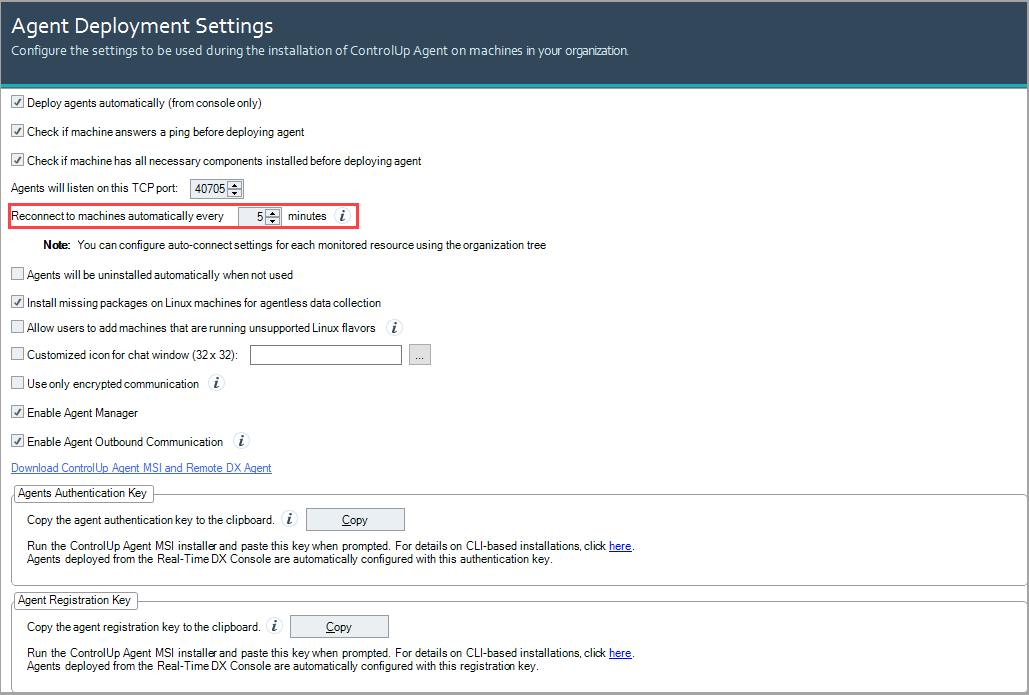
If all machines are set to automatically connect in large environments, this might extend the console launch process. Select only important servers or folders to automatically connect.
5. Excluding folders from the Monitor
By default, all folders, hypervisors, and machines are monitored. You can reduce the monitored resources to optimize monitor performance.
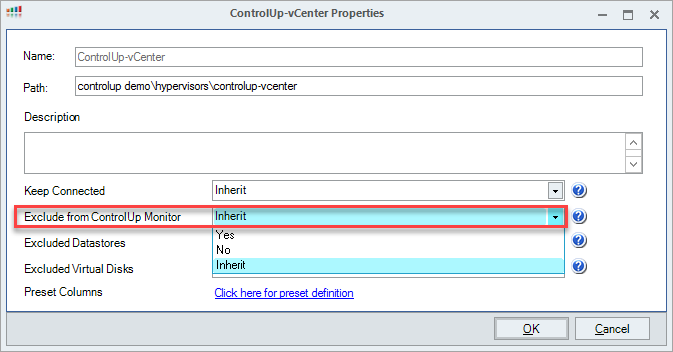
Right-click a resource in your organization tree, such as a machine, folder or hypervisor extension, and select Properties. In the Properties Window, under Exclude from ControlUp Monitor, change the value as needed:
- Yes. The monitors won't collect data from this resource.
- No. The monitors will collect data from this resource.
- Inherit. Inherits the configuration from the root folder.
From version 8.6.5 and higher, you can check which resources are monitored with the Invoke-CUQuery cmdlet.
6. Disable Console Incidents Processing
After you add a monitor, it is responsible for all your incident collection and trigger alert notifications. When the console is running, it also processes and collects all incidents in parallel to the monitor.
To disable the incidents collection and free up console resources, open regedit.exe on the machine running the console by using the following registry setting:
Key: HKEY_CURRENT_USER\SOFTWARE\Smart-X\ControlUp\Console
Value: DisableIncidents
Data Type: REG_DWORD
Data Value: 1
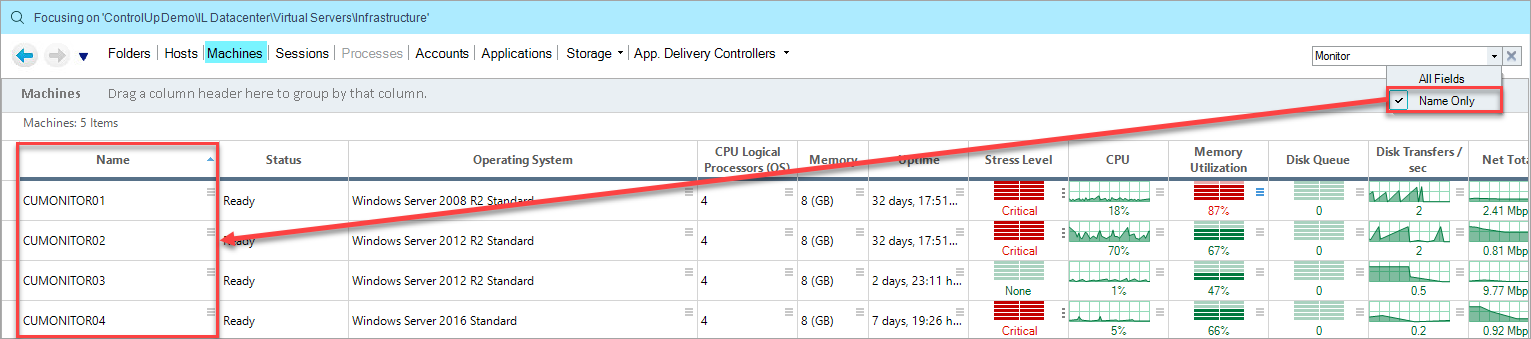
7. Change the Search Options to Name Only
By default, all fields are searched in the search field. If you change the default search option to Name only, the console will use fewer resources since the search is only filtered to the Name column.
You can configure this search behavior in our GPO template. In the Microsoft Group Policy, click ControlUp > Console > Advanced Settings and configure the Search box behavior settings. To learn more about configuring the console UI with group policies, see here.
8. Uncheck "Deploy agents automatically"
By default, the Deploy agents automatically checkbox is selected in Agent Deployment Settings.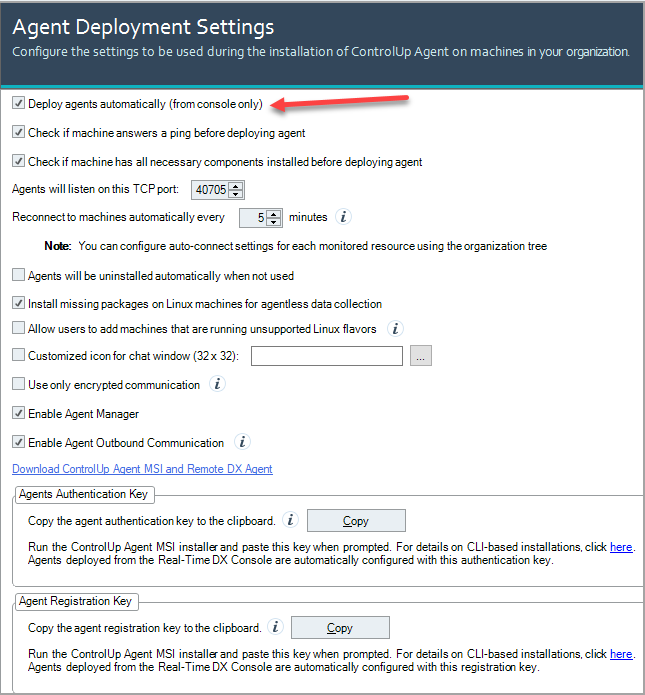
Note that from version 9.0, the Deploy agents automatically option doesn't apply to monitors. If you select this option, the console still automatically deploys the agents.
By unselecting that option, you take control of the agent deployment. Otherwise, when the console attempts to connect to a monitored machine or endpoint and fails, it will attempt agent deployment. In large environments that might cause degradation in console performance, try to deploy the agent in the background to all agents which aren't connected.
If the checkbox is selected, the monitor will try to connect to all machines in the folder tree (besides those who were excluded), which will cause high resource consumption.
We recommend disabling Automatic Agent Deployment for VDI customers with more than 1000 computers.
Was this article helpful?