Forecasting in Insights Reports
- Print
- DarkLight
- PDF
Forecasting in Insights Reports
- Print
- DarkLight
- PDF
Article Summary
Share feedback
Thanks for sharing your feedback!
Important
This feature is available only in ControlUp's Hybrid Cloud solution, not in Insights On-Premises (IOP).
Important
This feature is available only in ControlUp's Hybrid Cloud solution, not in Insights On-Premises (IOP).
The following summary briefly explains how to add forecasts of future trends to an Insights trend report (currently only available in the Host Trends report). More detailed information can be found in the rest of this guide.
Step 1. In the scope settings, select either a folder or a specific host to include in the report (see What Forecasts Are Available? ).
Step 2. Select the timeframe of the historical data on which to base the forecast, in one of the following ways:
- Select either the 1M or 1Y
- Select a user-defined timeframe, beginning at least 14 days ago, and ending on the current date.
Note
A longer timeframe is required for longer forecast periods, and is generally preferable in any case (see Supported Timeframes and Forecast Periods).
Step 3. Select the Forecast checkbox. Forecasts for the default forecast period are added to the graphs for which this feature is supported. The forecast graph appears as a dotted line to the right of the historical graph.
Step 4. If you want to change the forecast period, to the right of the Forecast checkbox, open the dropdown list and select the required forecast period. The forecast is recalculated and redrawn accordingly.
Figure 1: RAM Utilization trend graph with historical data on the left and predicted values on the right
Overview
Among the data stored in the Insights database is information about the organization’s resource consumption. This information can be used not only to describe and explain past events and behavior that occurred in the organization, but also to predict future resource requirements. Identifying upcoming resource needs can significantly improve planning and budgeting. For this reason, some Insights reports that track resource-usage include an option for viewing forecasts of future demand. These forecasts are generated using a complex algorithm that is capable of independently identifying patterns of different types in the historical data stored in the database and computing expected future values based on these patterns.
Forecasting is, of course, only as good as the data upon which it is built. For this reason, Insights only generates forecasts if there is a fairly large amount of relevant historical data, with a broad enough range of values, in the database. Thus, for example, a forecast can only be created if it is built on at least 14 days’ worth of historical data.
Insights’ forecasting has been tested on data from VMware, XenServer, Hyper-V, and AHV, and has produced reliable results with all of these platforms.
What Forecasts Are Available?
At present, forecasting is available in the Host Trends report, for the following metrics:
- VM Count (folder only)
- CPU Utilization (folder or host)
- RAM Utilization (folder or host)
Forecasting is only available when the scope of the report is either an entire folder or a single host; predictions for multiple individual hosts are not supported.
Supported Timeframes and Forecast Periods
Each forecast is derived from the historical data of the timeframe selected for the report. For example, if the report covers the past month, the forecast is based on the data from the past month.
Forecasting is always based on the latest historical data available. That is, the endpoint of the timeframe selected in the report must be “now” (which means either the current day or the day before). You can specify the timeframe either by selecting one of the presets (1M or 1Y – the other presets are not long enough to be used in a forecast) or by configuring a user-defined timeframe (see figure 3 below). If you employ a user-defined timeframe, make sure the timeframe includes enough days for the forecast period (see the Minimum Timeframe column in the table below), and the end date of the timeframe is “now.”
The forecast period – the time range in the future that is covered by the forecast – always begins with the current day, and can cover one week, one month, three months, or one year. For each of these periods, a minimum range of historical data must be included in the timeframe of the report, as listed underMinimum Timeframe in the table below.
The resolution of the data in the forecast period also depends on the length of the forecast period, as shown under Forecast Resolution in the table below.
Forecast Period | Minimum Timeframe | Forecast Resolution |
1 week | 14 days | 1 hour |
1 month | 28 days | 1 hour |
3 months | 91 days | 1 day |
1 year | 180 days | 1 day |
In general, the more historical data that is included in the report timeframe, the more accurate the report is likely to be. Thus, even if the forecast period is only one month, it would be advantageous to select a report timeframe of one year, if historical data for the past year is in the database. Similarly, forecasts with a resolution of one hour are likely to be more accurate than those whose resolution is one day.
Adding Forecasts to a Report
In reports for which the forecast option is available (currently, only the Host Trends report), forecast controls are added to the upper-right of the screen, beside the timeframe controls. These controls are unavailable unless a supported timeframe is selected. (Normally, 24H is selected when you open the report, so the forecast controls are not available.)

Figure 2: Forecast controls beside timeframe controls (forecast not available)
When you select a timeframe for which forecasting is supported, Insights automatically calculates all of the forecast values. This is done to save time, because forecast calculations can take a while to perform. While the calculation is underway, the Forecast checkbox is hidden by a “working” icon (). When the calculations are finished, the checkbox becomes available.
Below the checkbox, a list of the metrics in the report for which a forecast can be generated is shown. To the right of the checkbox, the default forecast period appears.

Figure 3: Forecast controls beside timeframe controls (forecast available)
- To add forecasts to a report:
- At the upper left of the screen, in the report’s scope settings, select either a folder or a specific host to include in the report.
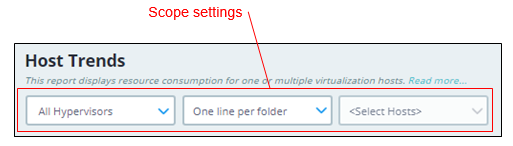

Figure 4: Scope settings
- At the upper-right of the screen, in the report’s timeframe settings (see figure 3), configure the timeframe of the historical to include in the report and to use as the basis for the forecast. Set the timeframe in one of the following ways:
- Select either the 1M or 1Y
- Select the user-defined From and To field, and then, in the calendar window, select the start date and time for the report. Ensure that the end date is either the current date or the day before. Then, select Apply .
- In the forecast controls, select the Forecast Graphs representing the forecast for the default forecast period appear in the results of the three metrics, VM Count (if the selected scope is a folder), CPU Utilization, and RAM Utilization, to the right of the graphs of the historical values.
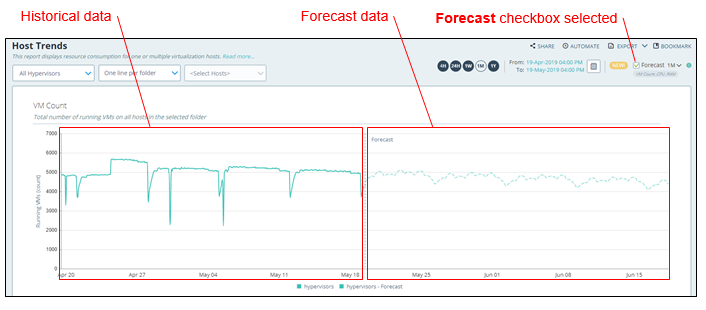

Figure 5: Report results with historical values plotted on the left and forecast values on the right
4. If you want to change the forecast period, to the right of the Forecast checkbox, select the arrow, and then, in the dropdown list of available forecast periods, select the required forecast period. The forecast is recalculated accordingly.
Note
Which forecast periods appear in the list depends on the selected timeframe. If the forecast period you want is not in the list, try selecting a longer timeframe.

Figure 6: Selecting a forecast period
Viewing the Forecast Results
The forecast results appear as a dotted line in the report results, to the right of the historical results, which appear as a solid line (see figure 5).
Hover over any data point in the forecast to open a pop-up window showing additional information about the data point. The metric, date and time, and scope of the data point appear in the upper half of the window. The lower part of the window shows the value represented by the data point, as well as values to either side of this value. The values to the sides define the range of values that are within a tolerance of 80% of the predicted value. This means that there is an 80% chance that the actual value will be in the specified range of values. For example, in the illustration below, the data point on the graph is 23, and the range of likely values is 21-25.

Figure 7: Pop-up window showing information about a data point in the forecast
How Forecasts Are Computed
ControlUp’s forecast feature uses an open-source software package called Prophet, which is available from Facebook, to analyze the historical data and construct predictions of future values. This software, and its implementation in Insights, is very robust, enabling it to produce accurate forecasts without requiring any expertise or input from users.
The forecasting process automatically identifies three types of fluctuations in the historical data set – trends, seasonality, and baseline shifts – and merges their effects into the forecast it produces. It also identifies and handles outliers and gaps in historical data.
Trend Fluctuations
Trend fluctuations reflect long-term, gradual processes, such as a steady increase in the number of users. The forecast process analyzes historical data to ascertain how much of its fluctuation should be attributed to gradual trends. It also decides which of two trend models best represents this fluctuation:
- Linear Trend model: This model is applied when the data values have no inherent limit – for example, the quantity of CPU units in the organization – and a steady rate of increase can be assumed.
- Logistic Trend model : This model is applied when the data values do have an inherent limit – for example, percentages, like the percentage of CPU usage – and are best modeled using a logistic curve, which has a sigmoid (“S”) shape that tends towards the maximum value.

Figure 8: Upward trend in historical data reflected in rising forecast
Seasonality
Seasonality is variability that has a repetitive pattern over time, such as variations in resource consumption at different times of day or on certain days of the week. The forecast process isolates and analyzes seasonality in historical data using Fourier series and the Stan probabilistic programming language.

Figure 9: Seasonality in historical data reflected in forecast
The ability of the forecast process to identify seasonality is limited by the resolution of the data set. For example, variance that corresponds to the day of the week can be identified if sufficient daily historical data is available, but patterns that are functions of the time of day can only be detected if hourly data is taken into account. Thus, for a forecast period of three months, whose resolution is one day, hourly fluctuations are not sought.
Baseline Shifts
Baseline shifts are one-time adjustments that move the entire function by a fixed amount, as would occur, for example, if additional servers were added to the organization. The forecast process identifies baseline shifts, and adjusts its calculations accordingly.

Figure 10: Baseline shift raises the entire forecast
Outliers
Empirical data sometimes includes data points that are exceptional for some reason, and do not really reflect the general trend of the data. Such anomalous data points are called outliers . During the analysis of the historical data, the forecast process identifies data points that should be treated as outliers, and removes them from the data set so that they don’t skew the projections.

Figure 11: Outlier in historical data does not affect the forecast
Gaps
Missing historical data points can also skew forecasts if they are not excluded from the data set. During the statistical analysis of the historical data, the forecast process takes gaps in the historical data into account, thus preventing such problems from arising.

Figure 12: Gaps in historical data do not skew the forecast
Additional Information
Additional information about how Prophet works can be found at the Prophet website, https://facebook.github.io/prophet/
Troubleshooting
1. The Forecast checkbox is not available.

The Forecast checkbox is unavailable whenever it is not possible to generate a forecast. This can occur for a variety of reasons. The most common are:
- The report timeframe is too short:
- One of these preset timeframes is selected: 4H, 24H, or 1W. Select a longer timeframe: either the 1M or 1Y
- The user-defined timeframe is selected, and it is too short to form the basis of a forecast. The timeframe must include at least 14 days.
- The user-defined timeframe is selected, and the end date is not configured correctly. The end date must be either the current day or the previous day.
- In the scope of the report, multiple individual hosts are selected. A forecast can only be generated for a scope of a single folder or a single host.
2. The Forecast checkbox is selected, but the forecast is not generated and an error message appears.
This message appears when the timeframe is appropriate for forecasting, but the historical data from this timeframe cannot be used to generate a reliable enough forecast. This is usually for one of the following reasons:
- There is insufficient historical data for the timeframe. Try selecting a longer historical timeframe.
- The data from the timeframe does not reflect enough activity – most of the values are 0. Try selecting a longer timeframe.
3. A technical error has occurred.
If a notification about a technical error appears, please contact technical support.

Was this article helpful?