Drill Down to Edge DX Device Data From Web UI
- Print
- DarkLight
- PDF
Drill Down to Edge DX Device Data From Web UI
- Print
- DarkLight
- PDF
Article Summary
Share feedback
Thanks for sharing your feedback!
You can drill down into Edge DX from the VDI & DaaS web UI to see more detailed information about the physical endpoint device that is connected to a session.
Prerequisites
This feature is available only if all of the following prerequisties are met:
- The endpoint device is running Windows.
- The Edge DX Agent is installed on the endpoint device. For details, see Edge DX Agent Distribution and Installation.
- The Remote DX plugin is installed on the endpoint device. For details, see Remote DX - Client Device Metrics.
- The Edge DX Agent is connected to an Edge Tenant within the same web UI environment you are using.
- An active user session is running on the endpoint device through a ControlUp managed machine within the same web UI environment - this means that ControlUp Agent data is available for the session.
- The ControlUp Monitor version is 8.5 or higher. (Version 8.5 is the first version that supports Remote DX data.)
Troubleshooting and Drilldown
To drill down to an endpoint device in Edge DX from the web UI:
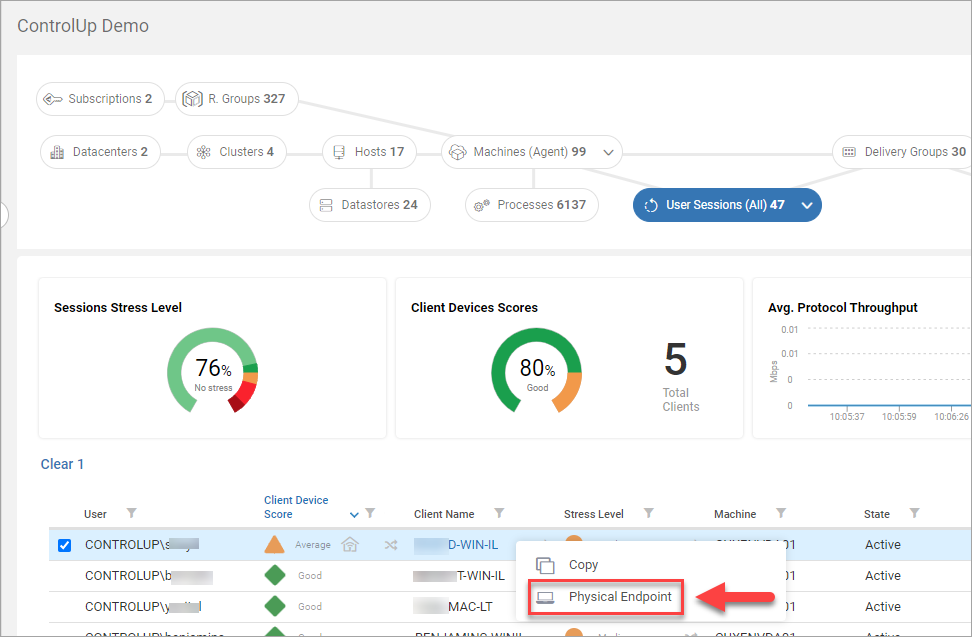
- Right-click a user session which meets all the prerequisites listed above.
- Click Physical Endpoint.
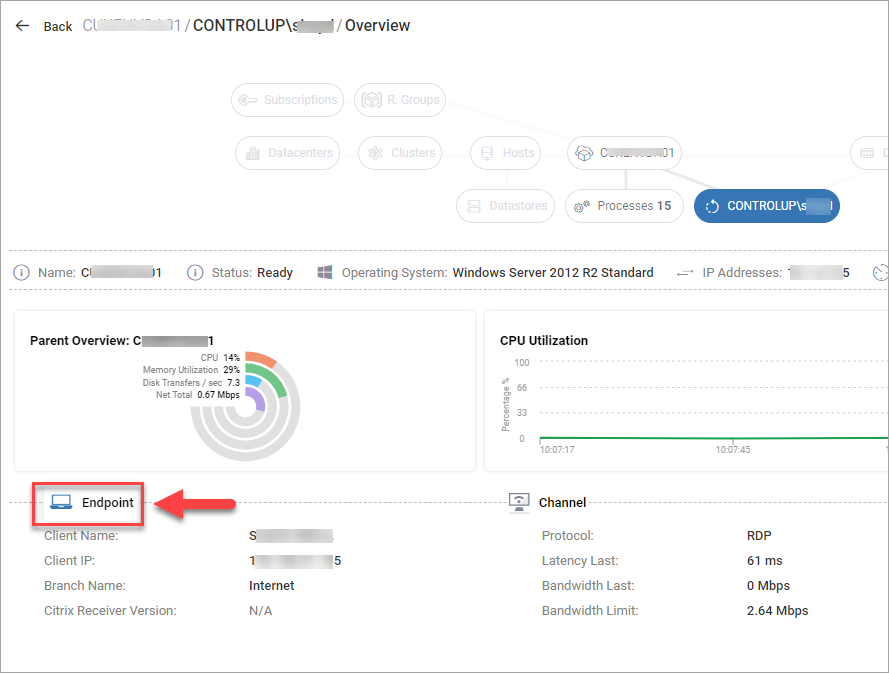
For Citrix sessions only, another way to drill down to an endpoint device displayed in Edge DX from the web UI, is to:
- Click on the user session to drill down into the session.
- In the session drilldown view, click the Endpoint button.
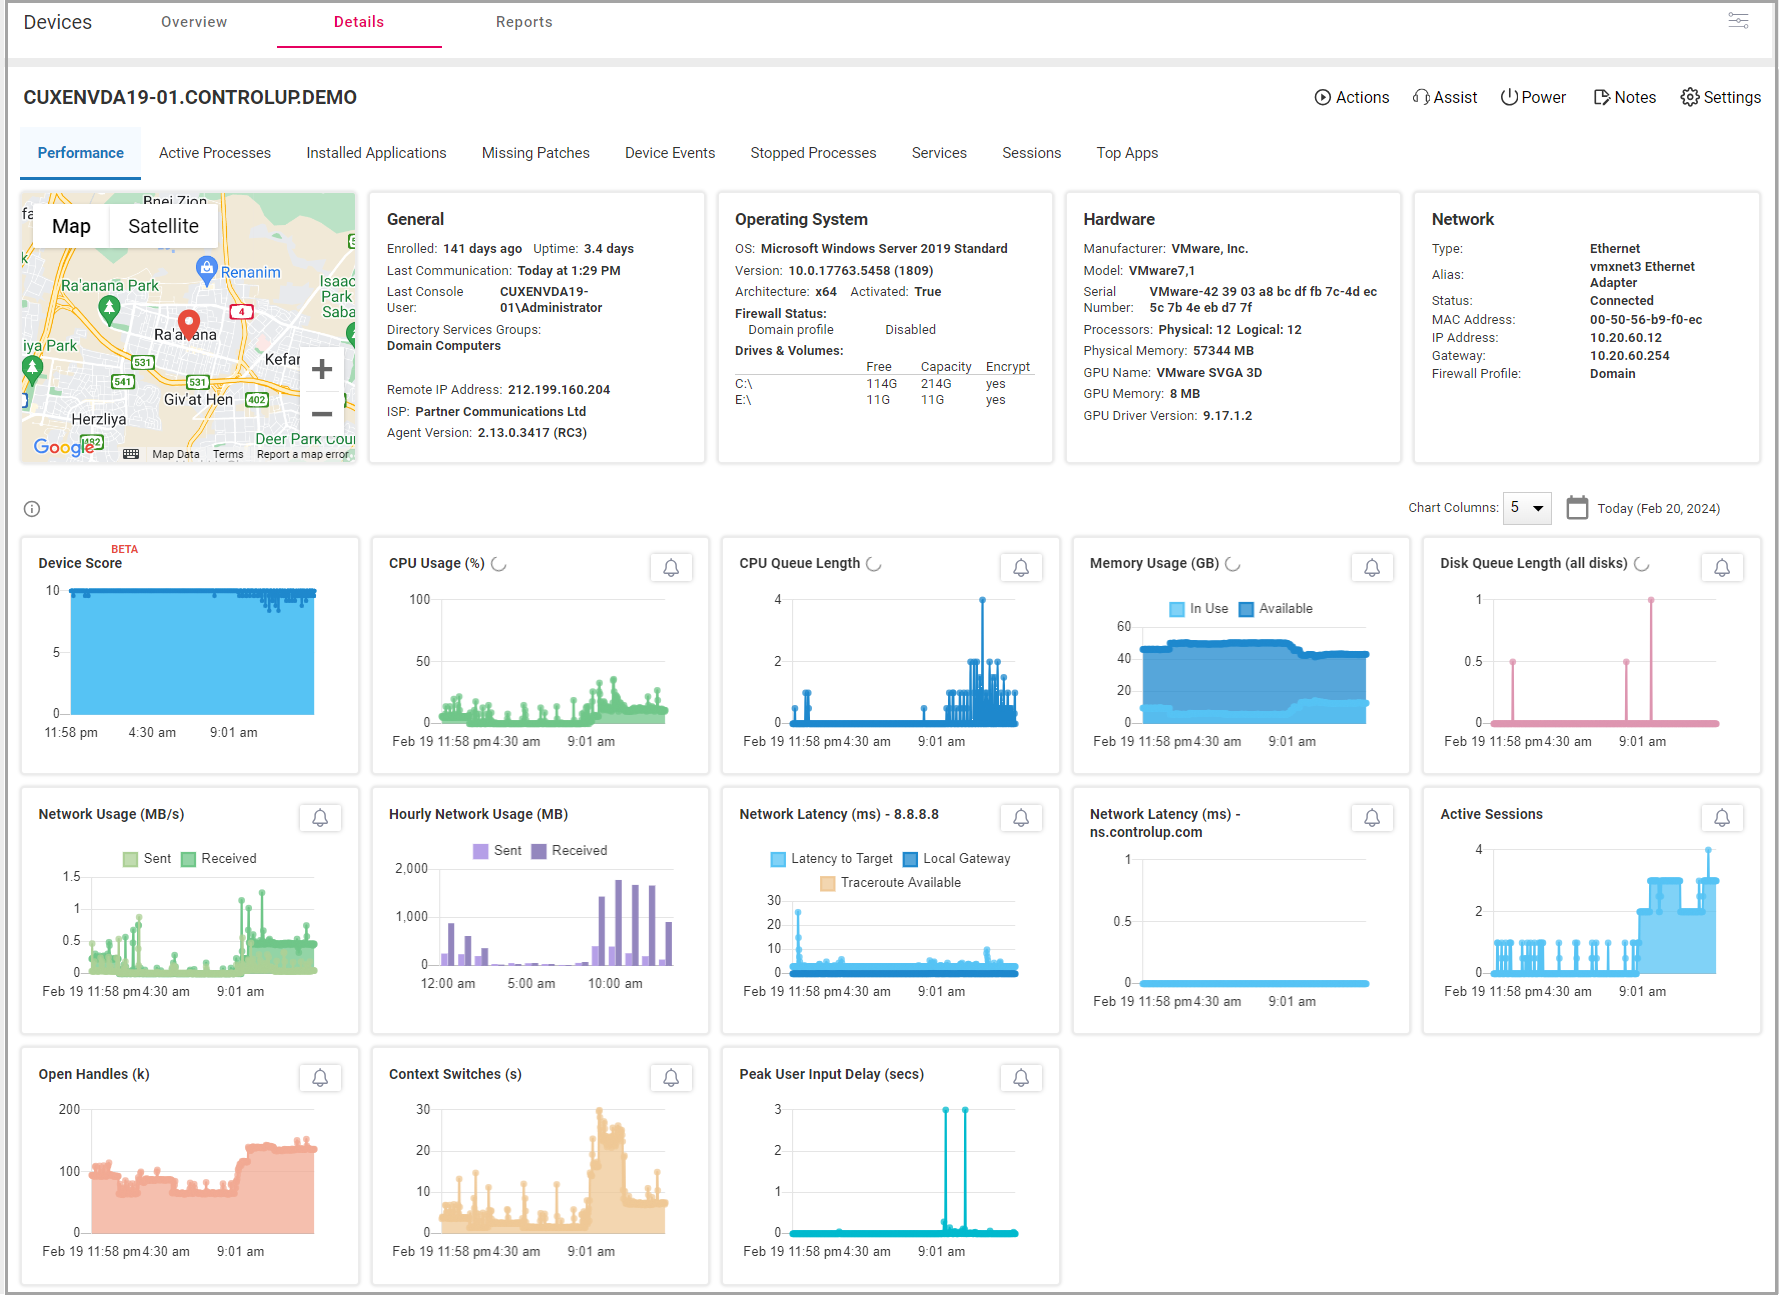
Whether you right-click on a user session and click Physical Endpoint, or click on a user session and then the Endpoint button, as described above, the Edge DX Device drill-down page opens, displaying the device data for the endpoint device.
Was this article helpful?