The following article explains how to configure a CVAD connection and monitor your CVAD components with ControlUp for VDI.
Data Collector
We recommend that you use a dedicated data collector for all EUC environment connections. A data collector can be any machine that has the ControlUp Agent installed. To check if a specific machine is already configured as a data collector, see here.
You can optionally run data collector directly on the delivery controller.
If you don't deploy the data collector on the delivery controller, then you must install the prerequisite snap-ins below. We recommend to install the same snap-in version that is installed on the broker.
From version 9.1.5, you can break down your cloud data connections with the Real-Time DX Console.
Prerequisites
PowerShell SDK Snap-ins
Citrix.Broker.Admin
Citrix.AdIdentity.Admin
Citrix.Configuration.Admin
Citrix.ConfigurationLogging.Admin
Citrix.DelegatedAdmin.Admin
Citrix.Host.Admin
Citrix.MachineCreation.Admin
Citrix.Monitor.Admin
Network Requirements
If you keep the SDK default TCP port 80 (HTTP) in the CVAD configuration, you only need to enable API port 80 from all Real-Time Console machines, Monitor machines, and Data Collector machines to the Citrix Virtual Desktops (XenDesktop) Broker.
If you change the SDK default TCP port from 80 to 443 (HTTPS) in the CVAD configuration, you must enable both API ports 80 and 443 from all Real-Time Console machines, Monitor machines, and Data Collector machines to the Citrix Virtual Desktops (XenDesktop) Broker.
For details on how to change your CVAD API ports from 80 to 443 in ControlUp, see Change Citrix API Connection Port to 443.
Service Account Requirements
Custom Permissions
ControlUp doesn't support custom permissions in Citrix Cloud environments.
The Read Only Administrator right to all managed farms is sufficient for all monitoring purposes. If you want to perform built-in CVAD management actions, then the service account needs the following permissions:
Edit Application Group Policies
Edit Application Properties (Application Group)
Edit Delivery Group Properties
Edit Machine Catalog Properties
Add your credentials to your shared credentials before you add the CVAD integration.
Data Collector Requirements
The data collector machine must have the CVAD PowerShell SDK installed. See Component Requirements above for details.
Add a CVAD Connection to ControlUp
To add a CVAD connection in your ControlUp environment, perform the following steps:
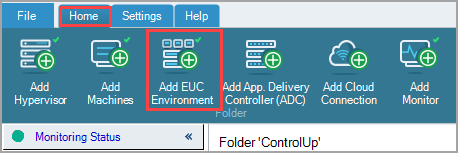
In the Real-Time DX Console, click Add EUC Environment.
Set the Solution / Platform to Citrix Virtual Apps and Desktops.
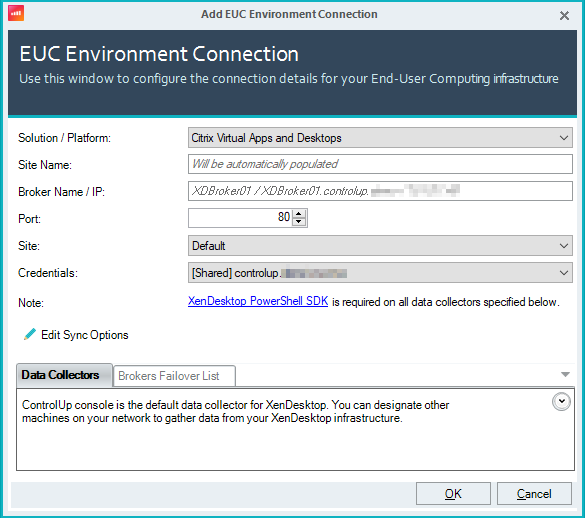
Enter the Broker Name / IP (FQDN, hostname, or IP address) of your CVAD Broker site.
Optionally, change the Port used to communicate to the Broker. The default port is 80.
Optionally, from 9.1: select the Site to assign the connection to.
Select Credentials for your CVAD environment from your shared credentials. The required permissions for the credentials are described above. You should have added these credentials as shared credentials in your Monitors Settings.
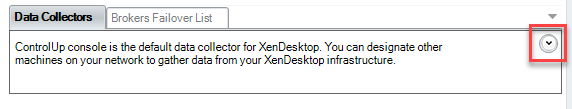
Expand the Data Collectors tab to configure a data collector for the CVAD connection.
Select the default data collector and click Remove.
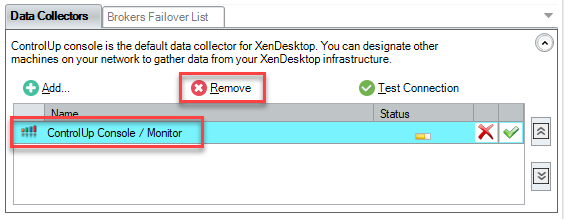
Click Add and select the machine that you want to use as a data collector.
Optionally, add another machine to use as a backup data collector in case the primary data collector is down. Note that the first machine in the list is the primary data collector.
Click OK to save the CVAD connection.
After ControlUp connects to your CVAD site, the Site Name field automatically populates, and the Brokers Failover List tab contains the names of all the Broker servers assigned to the CVAD site.
CVAD Known Issue: Citrix.Monitor.exe memory leak
CVAD brokers might not function properly due to higher than expected memory consumption by the Citrix.Monitor.exe process. To resolve this issue, update CVAD to Current Release 2503 or LTSR 2402 CU2.
If updating CVAD doesn’t resolve this issue, you can disable Pendo notifications by following the official Citrix documentation instructions.
CVAD Monitoring
After you add a CVAD connection, ControlUp discovers Virtual Desktop Agents (VDAs), delivery groups, and brokers associated with your CVAD environment. In the Real-Time DX Console, you can see:
VDAs and brokers in the Machines view.
Open sessions on the VDAs or broker in the Sessions view.
Running processes of open sessions in the Processes view.
Information about published applications in the Applications view.
Resources monitored with ControlUp will be enriched with CVAD-related metrics and metadata. For example, the Machines view has the column CVAD Machine Availability to show if VDAs are accessible by users, and the Sessions view has the column CVAD Launched Via HostName to show the name of the StoreFront server used to launch each session.
The CVAD site appears in your organization tree under EUC Environments. You can see the delivery groups and brokers under the CVAD site. Select one of these folders to show information relevant to only that folder.
Note
The subfolder of a CVAD site (delivery groups and brokers) are not stored in ControlUp's configuration and can't be used to configure stress settings, triggers, or column presets. To use these features, you need to install the ControlUp Agent on these machines.
For a reference of the CVAD information you can monitor, visit CVAD Integration: Columns & Grids Overview.
To monitor performance metrics of your VDAs and broker machines, you can install the ControlUp Agent on these machines.
From version 9.2, you can monitor and remediate Citrix VDA registration states on these machines.
Licensing
Each session discovered by the CVAD connection uses 1 ControlUp license.
Monitor Broker Health
You can monitor the health of each broker in the CVAD site. The CVAD Broker Health column shows the overall health of your CVAD environment by monitoring the key services and connections of brokers. This metric is based on a list of services, databases, and hypervisors. If all these parameters are running and available, the broker's health is 100%. If some parameters are not healthy, the health % decreases.
You can exclude each parameter that the calculation is based on from the registry. By default, the % hypervisors available is excluded. See below for more details.
The CVAD site row shows an aggregated calculation of how many % of brokers are 100% healthy: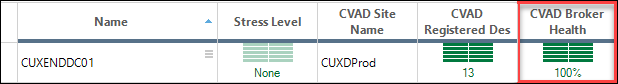
Calculating Broker Health
We calculate CVAD Broker Health based on:
- Service statuses
- Hypervisor connections availability and status
- License server connections availability and status
Service Status
The following table describes the service statuses we use to calculate broker health:
Service | ControlUp Metric | PowerShell Cmdlet |
|---|---|---|
ADIdentityServiceStatus | CVAD AD Identity Service |
|
BrokerServiceStatus | CVAD Broker Service |
|
CentralConfigServiceStatus | CVAD Central Configuration Service |
|
ConfigurationLoggingServiceStatus | CVAD Configuration Logging Service |
|
ConfigurationLoggingDatabaseState | CVAD Configuration Logging Database |
|
DelegatedAdminServiceStatus | CVAD Delegated Admin Service |
|
HostingUnitServiceStatus | CVAD Hosting Unit Service |
|
MachineCreationServicesStatus | CVAD Machine Creation Services |
|
MonitorDatabaseState | CVAD Monitor Database |
|
MonitorServiceStatus | CVAD Monitor Service |
|
SiteDatabaseState | CVAD Site Database |
|
Hypervisor Status
We also use the status of all hypervisor connections (HypervisorConnectionsAvailable) to calculate CVAD Broker Health. You can use the Get-BrokerHypervisorConnection PowerShell cmdlet to query the hypervisor connection state for each hypervisor connection in your Display Data Channel (DDC). Each connection can be one of the following statuses:
In Maintenance. Number shown in the CVAD Hypervisors Failed metric.
On. Number shown in CVAD Hypervisors OK metric.
Unavailable. Number of connections shown in the CVAD Hypervisors Failed metric.
The ControlUp Agent temporarily stores the value of the XD% Available Hypervisor Connections metric in your registry under HKEY_LOCAL_MACHINE\SOFTWARE\Smart-X\ControlUp\Agent\XenDesktopHealth. This metric is calculated as:
Number of Hypervisors OK / (Number of Hypervisors Failed + Number of Hypervisors OK X 100)
License Server Connectivity
Additionally, the license server connection (LicenseServerAvailability) is assessed in the CVAD License Server metric. If the license server is disconnected, one point is deducted from the total.
Example
CVAD Broker Health is calculated using the 13 parameters above (11 service states + hypervisor status + license server connectivity). If any of these services or connections return a status of DisabledByRegistry, one point is deducted from the total.
The final health score is calculated as:
(FieldsOK/13) X 100
For example, if 8 out of the 13 monitored services are running normally, then broker health is calculated as:
(8/13) X 100 = 61.5%
Known issues
In some cases, you might experience decreased Citrix performance and high memory consumption on the citrix.monitor.exe process due to extra calls from our Data Collector.
To fix this issue:
Go to
C:\Program Files\Citrix\Monitor\Serviceand open Citrix.Monitor.exe.config.Add the following line to change the default page size for the OData V4 endpoint:
add key="ODataV4ResponsePageSize" value="1000"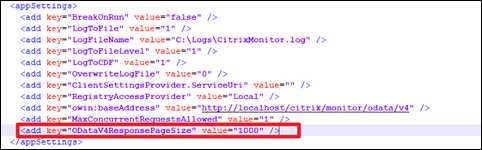
Restart the Citrix Monitor service.