The following article describes different deployment topologies, including all major components and their communications model, data stored in the relevant data stores, and data protection mechanisms.
ControlUp Architecture
ControlUp supports the following options for monitoring your VDI & DaaS environments.
ControlUp Hybrid Cloud Mode
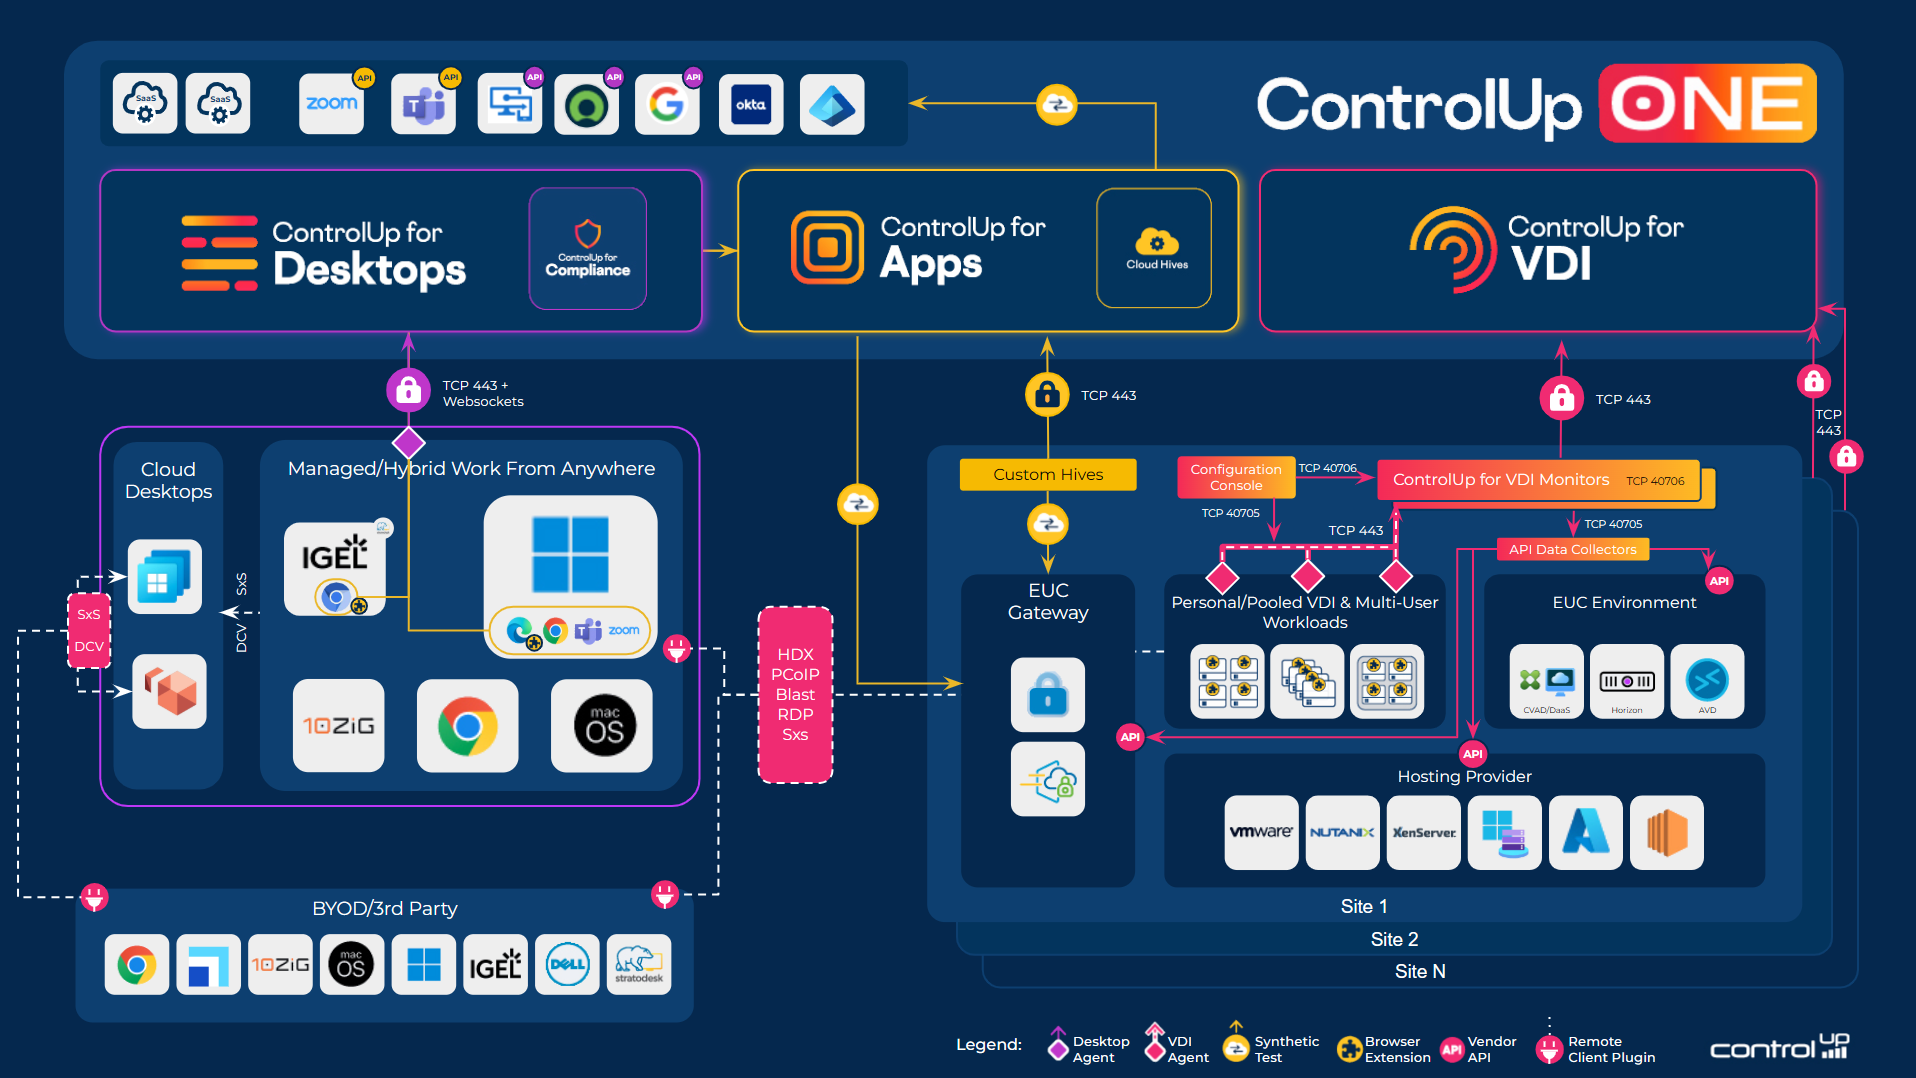
ControlUp Hybrid Cloud mode is enabled by default if your network has internet connectivity. In this mode, the ControlUp backend components are hosted on our secured cloud servers. The ControlUp Real-Time Console and Monitor run in your organization's network.
The following image is a high-level overview of ControlUp's architecture when working in Hybrid Cloud mode:
ControlUp On-Premises Mode
ControlUp On-Premises (COP) mode enables organizations to install the ControlUp back-end components on their on-premise data center. In this mode, both the ControlUp back-end components and the ControlUp Console and Monitor run on your organization's network.
For details, see ControlUp Architecture - On-Premises.
ControlUp for VDI & DaaS Components
The following software components comprise the ControlUp architecture.
Customer Network Components
ControlUp Console is the main component you use for real-time management and monitoring of your virtual infrastructure, physical and virtual servers, VDI, and RDS environments, as well as monitoring physical endpoints and applications.
Real-Time Console
The console distributes the ControlUp Agents to the managed machines/VMs and exposes the UI which enables administrators to configure hypervisor connections, CVAD sites, Citrix ADC appliances, AWS regions, and monitor services.
The console maintains communication with the relevant managed machines/VMs, hypervisors, CVAD sites, Citrix ADC appliances, and AWS regions, and displays real-time performance data. It also communicates with the ControlUp backend servers for various operations.
ControlUp Monitor Service
The ControlUp Monitor service is a key component in any ControlUp deployment. The Monitor Service performs the following major functionalities:
- Incidents reporting and alerting.
- Historical data uploads.
- Gateway to VDI App in app.controlup.com.
Once you install and start it, the ControlUp Monitor logs into your ControlUp organization and connects to your managed machines/VMs, hypervisors, CVAD sites, Citrix ADC appliances, and AWS regions. The monitor starts receiving system information and performance updates from your organization, just like an additional ControlUp Console instance.
The primary difference between a ControlUp Monitor Service and a Console is that the Monitor runs as a Windows service, requiring no user interaction and allowing for continuous monitoring of your resources, ensuring continuous coverage for incident alerting and reporting capabilities.
The ControlUp Monitor Service also uploads the historical data used for generating reports and analytics displayed in our web console UI.
Data Collector
A software component that collects performance and configuration information from the hypervisor management web service, CVAD sites, Citrix ADC appliances, and AWS regions via remote API calls. By default, each ControlUp Monitor Service is configured as a data collector which pulls data directly from the connected hypervisors (ESXi, AHV, Hyper-V, or Citrix Hypervisor), CVAD brokers, and Citrix ADC Connector.
As a best practice to increase performance in a production deployment, we recommend that you configure a dedicated data collector to act as a proxy for all other ControlUp Consoles and Monitor Services. For more performance optimization reccomendations, see Performance Optimization for Real-Time Console & Monitor.
Connection Types
ControlUp uses TLS (Transport Layer Security) version 1.2 protocol for communication between our backend and installed components.
vSphere
The ControlUp Data Collector communicates with the configured vCenter server via the SDK web service, and the default communication channel is based on the SSL protocol. By default, data collection occurs every 20 seconds, and a read-only account is sufficient to pull all configuration and performance data.
To enable VM Power Management, go to the Virtual Machine/Interaction category and enable the following: ⧫Power Off ⧫Power On ⧫Reset.
Citrix Hypervisor
By default, the ControlUp Data Collector communicates with the configured Citrix Hypervisor via port 80, and also communicates directly with each Citrix Hypervisor pool member to pull the real-time performance metrics via the RRD API. By default, data collection occurs every 20 seconds and a read-only account is sufficient to pull all configuration and performance data.
To enable VM Power Management, upgrade the user role to VM Operators.
Citrix Connector
By default, the ControlUp Data Collector communicates with the configured CVAD Broker via port 80 to pull configuration and performance data. During the initial connection, the data collector discovers all CVAD Brokers and saves them in the Broker's Failover List to enable data collection in case the first CVAD Broker isn't available. The data collector utilizes both the PowerShell and OData APIs to pull relevant data in Delivery Groups, Brokers, VDA’s, User Sessions, and Published Applications.
The Read-Only Administrator right to all farms that will be managed is sufficient for monitoring purposes. If you require access to use the built-in CVAD management features, for example, enabling maintenance mode, then this account will require the following permissions:
- Edit Application Group Properties
- Edit Application Properties (Application Group)
- Edit Delivery Group Properties
- Edit Machine Catalog Properties
Cloud Connector
The ControlUp Data Collector communicates with AWS's .Net SDK over HTTPS.
The data collection includes the following intervals:
| Data | Intervals |
|---|---|
| Metadata. Machine name, state, etc. | 20 seconds |
| AWS CloudWatch. Depending on if the AWS instance has detailed monitoring or not, as defined on the instance itself. | 1 minute |
| Detailed monitored instances | 1 minute |
| Non-detailed monitored instances | 5 minutes |
Citrix ADC Connector
The ControlUp Data Collector communicates with the Citrix ADC appliance over HTTP or HTTPS, depending on the user’s preference over API. The data collections intervals depend on the size of Citrix ADC deployment and are configurable.
ControlUp Agent
The ControlUp Agent is a software component that collects performance information on the managed machine/VM, and sends it to the ControlUp Console or to the ControlUp Monitor instances that are currently running in the network and are connected to the managed machine/VM. The ControlUp Agent also executes the management actions performed by the users running the ControlUp Console.
For further information, see What are the benefits of using the ControlUp Agent?.
Cloud-Based Backend Components
ControlUp Cloud Servers
ControlUp Cloud Servers reside in the AWS cloud (US and Ireland datacenters) and provide login, licensing, central configuration, and database services for all ControlUp Consoles and Monitor service instances running on the customer network.
Data Stores
ControlUp uses the following data stores for VDI & DaaS deployments.
In-RAM Database
A proprietary database is used by each ControlUp Console/Monitor Service instance to store all real-time performance and configuration data gathered by the data collectors. This database is a volatile database, which exists only when the console/monitor executable is running. The Security Policy of the console allows for proper role-based maintenance of its various features. The in-RAM data retention policy allows up to 100 historical transactions per counter.
Configuration Database
The ControlUp central configuration is hosted on a Lightweight Directory Services database. The location of the database depends on the ControlUp topology you chose. For example, the configuration database for Hybrid-Cloud is stored on the ControlUp Servers running in the AWS Cloud.
The configuration database includes all persistent configuration objects that are part of the ControlUp organization, including the following (all items not listed):
-
Default distribution settings:
- Auto-Upgrade
- Check Ping
- Check Prerequisites
- Default Port
- Temporary / Permanent Mode
- Keep-Connected Interval
-
Hypervisor connection settings
-
XD connection settings
-
Cloud connection settings
-
Citrix ADC connection settings
-
Managed machine/VM data:
- Install Mode (temporary/permanent)
- CPU Count
- Domain Role (Workstation / Member Server / etc)
- Highest session count (Max value of the ‘session’ counter)
- Manufacturer
- Model
- OS Caption
- OS Service Pack
- Physical (MAC) Address (used for Wake-On-Lan)
- System Type (x86 / x64 / etc)
- Total RAM
- Domain DNS
- ControlUp Port
- Netbios Name
- FQDN
- Description
- Last Connection Error
-
Folder data:
- Name
- Description
-
Delegation data:
- All entries configured by the user
- Owner information:
- NT Account Name
- NT Account SID
- Role Information:
- NT Account Name
- NT Account SID
- Stress Settings:
- Stress Settings configured by the user
- RDP Connection Properties:
- Authentication Level
- Connect to console
- Device Redirection Configuration
- SmartSize settings
- Connect to console
- Start Full Screen
- Start Program on connection
- Name
- Port
- AD Connections (metadata only)
- Branch Mappings
- Trigger Settings
- Generic ControlUp configuration settings
User credentials are never stored in the configuration database.
All data objects in the configuration database are encrypted using the Rijndael algorithm (AES) with a per-customer random 128-bit encryption key. In Hybrid Cloud mode, the encryption key is stored on the ControlUp Cloud servers and protected using DPAPI. In On-Premises mode, the data is encrypted for obfuscation purposes only and the key is stored locally, with a secret hardcoded string.
All data objects are encrypted locally, at the Console/Monitor instances, before being transmitted over the network to the relevant web services/database.
Incidents Database
Incident Triggers are definitions of significant events that should be recorded by ControlUp for later analysis. Each trigger includes a list of conditions that specify when the incident will be recorded and which follow-up actions will be performed at that time.
The incidents database contains all historical incidents that were reported by the ControlUp consoles and Monitor services based on the customer triggers definitions. The information stored in the incidents database can be viewed via the ControlUp Incidents Pane.
The incidents database is hosted on a Microsoft SQL Database. In Hybrid Cloud, the incidents database is stored on ControlUp's AWS RDS instance. In On-Premises, the incidents database is stored on a Microsoft SQL Server running on the customer network.
Sensitive data-related incidents such as host and machine names, IP addresses, account names, event message data, and process command lines are encrypted using Rijndael algorithm (AES) with a per-customer random encryption key. In Hybrid Cloud, the encryption key is stored on the ControlUp Cloud servers and protected using DPAPI. In On-Premises mode, the data is encrypted for obfuscation purposes only and the key is stored locally, with a secret hardcoded string.
All incidents are encrypted locally, at the Console/Monitor instances, before being transmitted over the network to the relevant web services/database.
Local Cache
Configuration cache files are stored on the machine running the ControlUp Console and the Monitor Service, in the Application Data directory under the user’s profile (e.g. (UserProfile)\AppData\Roaming\ControlUp). By default, NTFS restricts access to the file to allow only the specific user and members of the local administrators group.
If the files are copied and used by a different user, the encrypted data can't be decrypted and the user will have to re-enter all passwords. Other configuration data will be available.