You can use ControlUp for Desktops to track which applications/URLs your end users are using and for how long. Due to privacy concerns, you can customize this feature to control which applications are tracked and whose activity is monitored.
Access the End User Activity Dashboard
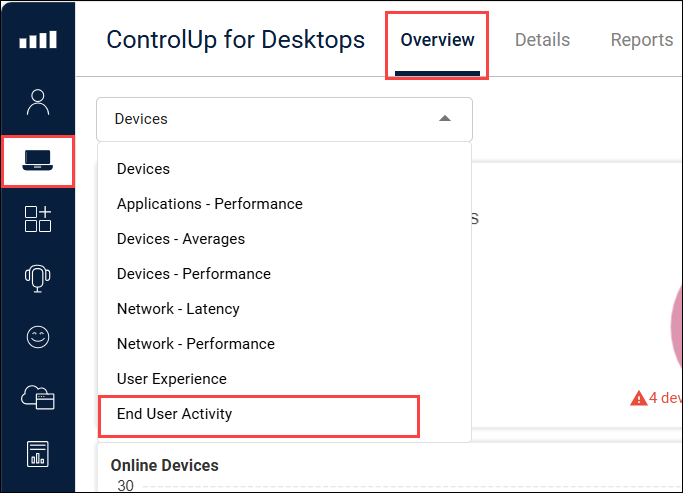
To access the End User Activity dashboard, go to the ControlUp for Desktops > Overview and select End User Activity from the dropdown.
Dashboard Details
The End User Activity dashboard displays two types of end user activity data:
- End user activity on applications
- End user activity on websites (URLs)
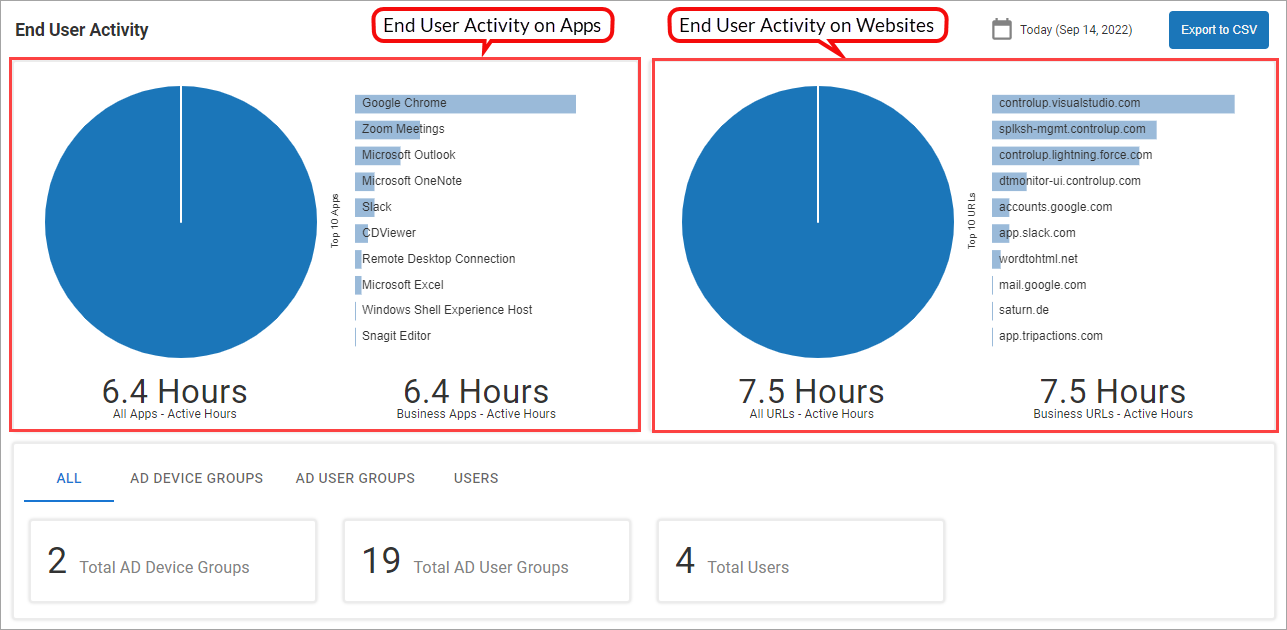
See the table below for details about the End User Activity data displayed on the dashboard:
| End User Activity Type | End User Activity Data | Additional Details |
|---|---|---|
| Activity on applications | ||
| All Apps - Active Hours | Total hours of activity on all apps (see definition of Active Hours below). | |
| Business Apps - Active Hours | Hours of activity on apps defined as Business Apps in End User Activity - Data Collection Settings. | |
| Pie Chart | Business Apps - Active Hours is represented by the blue portion of the pie chart, while the yellow portion of the pie chart represents activity on all apps not defined as Business Apps in End User Activity - Data Collection Settings. Hover over the portions of the pie chart to see the details of the data behind the graphic display. | |
| Top 10 Apps | Hours of activity on the ten most used apps. Hover over the bars in the bar chart to see the details of the data behind the graphic display. | |
| Activity on websites | ||
| All URLs - Active Hours | Total hours of activity on all websites (see definition of Active Hours below). | |
| Business URLs - Active Hours | Hours of activity on websites defined as Business URLs in End User Activity - Data Collection Settings. | |
| Pie Chart | Business URLs - Active Hours is represented by the blue portion of the pie chart, while the yellow portion of the pie chart represents activity on all websites not defined as Business URLs in End User Activity - Data Collection Settings. Hover over the portions of the pie chart to see the details of the data behind the graphic display. | |
| Top 10 URLs | Hours of activity on the ten URLs having the most hours of activity. Hover over the bars in the bar chart to see the details of the data behind the graphic display. |
Active Hours on an app or URL is the time during which the app or URL is active in the foreground of the end-user's screen, the screen isn't locked and the device is not timed-out or idle.
The end user activity data displayed on the End User Activity dashboard is per the preferences configured in the End User Activity - Data Collection Settings, and the User and Date Range preferences selected on the End User Activity dashboard (see Configure End User Activity settings).
Configure End User Activity settings
You can customize the End User Activity dashboard to display end user activity on particular apps and websites, for a specified individual end user or group of end users, and/or for a specified time period.
In order for any end user activity to be displayed on the End User Activity dashboard, the Collect Active (Foreground) Applications and URL Domains setting must be enabled in the End User Activity - Data Collection Settings.
Additional preferences selected in the End User Activity - Data Collection Settings, as explained in detail below, determine the the depth and granularity of the end user activity data collection. The end user activity data that is collected is then refined further according to the User and Date Range preferences configured on the End User Activity dashboard (see Set a User preference for the End User Activity dashboard and Select a Date Range for the End User Activity dashboard below). The refined user activity data is displayed on the End User Activity dashboard.
Set a User preference for the End User Activity dashboard
To display end user activity data for a particular user or group of users on the End User Activity dashboard, set a user preference on the dashboard. To do so, click one of the end user selection options appearing at the bottom of the page, as shown in the screenshot below.
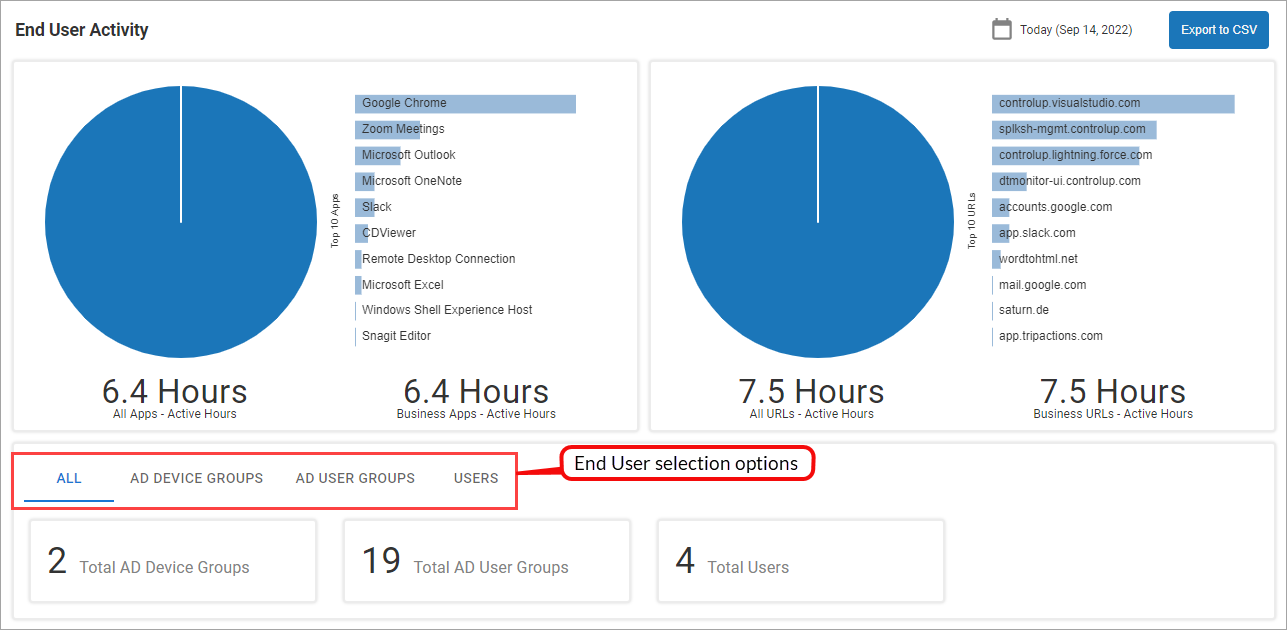
See the table below for details about the end user selection options:
| End User selection options | Additional Details |
|---|---|
| All | End user activity data is shown in aggregate for all end users. |
| AD Device Groups | End user activity data is shown for groups of end users, which are grouped according to Active Directory Device Groups. Select the checkbox of one or more Device Groups to see the end user activity data for the selected specific Device Group or Groups. |
| AD User Groups | End user activity data is shown for groups of end users, which are grouped according to Active Directory User Groups. Select the checkbox of one or more User Groups to see the end user activity data for the selected specific User Group or Groups. |
| Users | End user activity data is shown for all individual end users. Select the checkbox of one or more users to see the end user activity data for the selected specific user or users. |
In order for End User Activity to be displayed on the End User Activity dashboard for groups of users (AD Device Groups, AD User Groups) or for individual end users (Users) for a particular Date Range, collection of data at this level would have to have been enabled at that time. If collection of data of a certain granularity was not enabled for a certain Date Range, no data of that granularity for that Date Range exists, so if it is selected for display on the End User Activity dashboard, no results will be displayed. See End User Activity Data Collection Settings for more details on enabling the collection of end user activity data at different levels of granularity.
Select a Date Range for the End User Activity dashboard
To display end user activity data for a particular period of time, select a particular date range on the dashboard as follows:
-
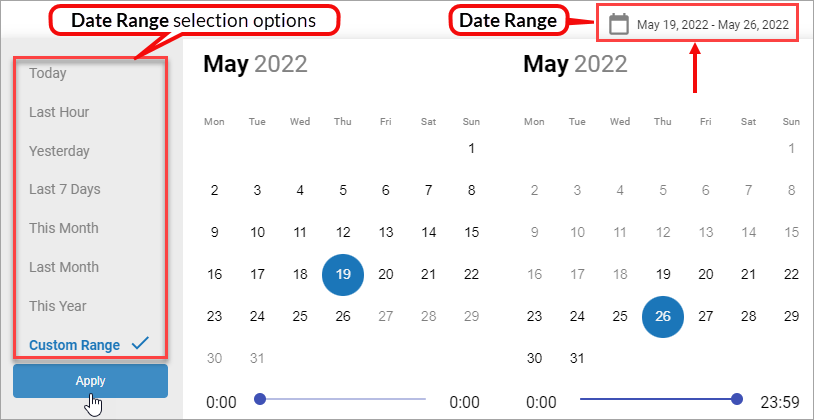
Click the displayed Date Range. The Date Range selection dialog box opens.
-
Select one of the Date Range selection options appearing in the Date Range selection dialog box. You can select one of the self-explanatory periods of time (i.e., Today, Yesterday, Last 7 Days, This Month, Last Month, or This Year). Another option is to select a Custom Range of days by selecting a start date and an end date for the Custom Range on the displayed calendar.
-
When selecting a Custom Range only, you also have the option to select a customized start time and end time for the selected Date Range. If you want to change the daily start and end times from the default times of midnight to midnight (0:00 until 23:59), use the sliders at the bottom of the Date Range selection dialog box to set a custom start time and end time.
-
Click Apply.
The End User Activity data collected according to the preferences configured in the End User Activity - Data Collection Settings is filtered for the selected Date Range time period, and displayed on the End User Activity dashboard.
End User Activity - Data collection settings
The preferences selected in the End User Activity - Data Collection Settings determine the depth and granularity of the end user activity data collection.
To configure the End User Activity - Data Collection Settings, perform the following steps:
- Go to ControlUp for Desktops > Configuration > Settings > End User Activity.
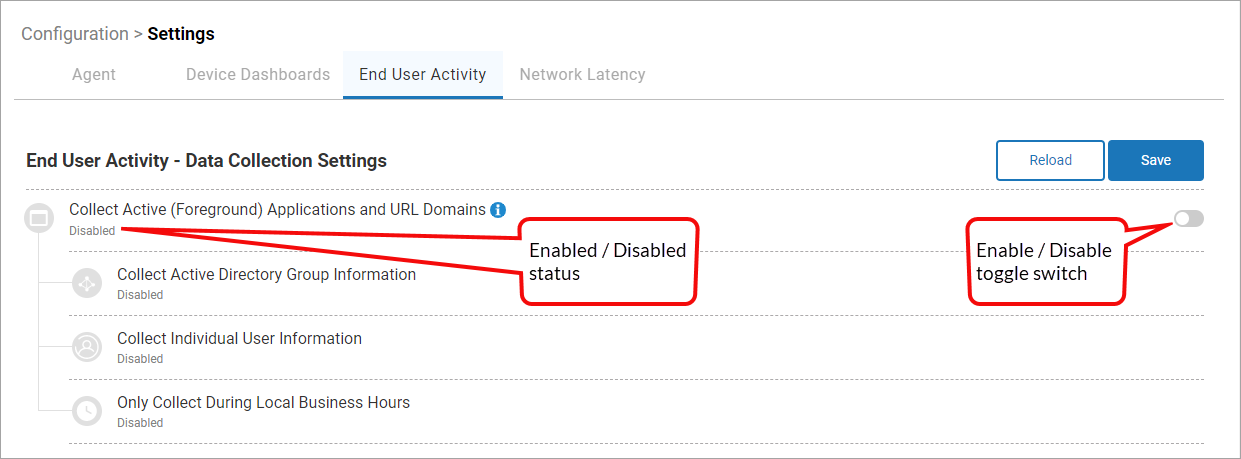
In the example screenshot shown above, the Collect Active (Foreground) Applications and URL Domains setting is shown to be in a disabled state. To allow any end user activity data collection at all, it is a prerequisite that the Collect Active (Foreground) Applications and URL Domains setting be enabled.
2. To enable end user activity data collection, enable the Collect Active (Foreground) Applications and URL Domains setting using its toggle switch.
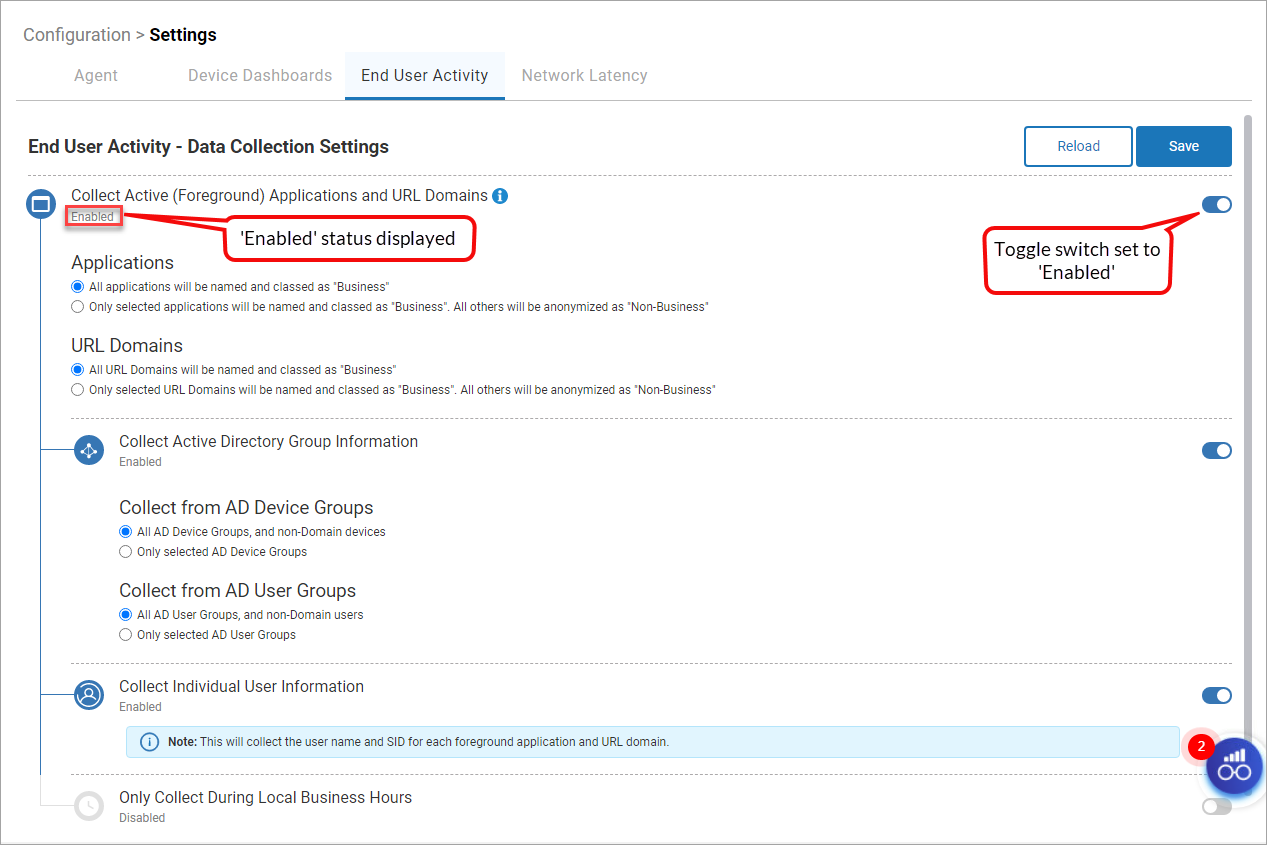
You can see that in the first screenshot, when the Collect Active (Foreground) Applications and URL Domains setting is disabled, only the toggle switch for that setting is visible and functional, while the toggle switches for the other settings are not visible. In addition, not all of the settings which appear when the Collect Active (Foreground) Applications and URL Domains setting is enabled, as seen in the second screenshot, can be seen when the setting is disabled, as a visual comparison between the second screenshot and the first screenshot reveals.
- Select your preferences for the End User Activity - Data Collection Settings. See the table below for details about the selection options.
- Click Save so that the collection of end user activity data proceeds in accordance with your selected preferences.
- Click Reload to reset the End User Activity - Data Collection Settings.
As shown in the screenshots above, the End User Activity - Data Collection Settings include four categories of settings, which are explained in the table below:
| Data Collection Settings - Category Setting | Data Collection Settings - Subcategory Setting | Setting Options | Additional Details |
|---|---|---|---|
| Collect Active (Foreground) Applications and URL Domains | Enabled / Disabled | Use the Enable / Disable toggle switch for this setting to enable or disable the collection of end user activity data. The current staus of the category setting is displayed beneath the category setting heading, as shown in the screenshots above. Enabling the Collect Active (Foreground) Applications and URL Domains settings category is necessary to allow any end user activity data collection, and to enable any of the other three settings categories. When the Collect Active (Foreground) Applications and URL Domains settings category is disabled, no End User Activity data is collected, the End User Activity dashboard display is empty, and the Enable/ Disable toggle switches for the other three settings categories are not visible. | |
| Applications | |||
| All applications will be named and classed as "Business". | If this option is selected, the Apps pie chart will be completely blue, and will not have a yellow portion representing user activity on Non-Business Applications. | ||
| Only selected applications will be named and classed as "Business". All others will be anonymized as "Non-Business". | If this option is selected, the Apps pie chart will have both a blue portion representing user activity on Business Applications, and a yellow portion representing user activity on Non-Business Applications. | ||
| URL Domains | |||
| All URL Domains will be named and classed as "Business". | If this option is selected, the URLs pie chart will be completely blue, and will not have a yellow portion representing user activity on Non-Business URLs. | ||
| Only selected URL Domains will be named and classed as "Business". All others will be anonymized as "Non-Business". | If this option is selected, the URLs pie chart will have both a blue portion representing user activity on Business URLs, and a yellow portion representing user activity on Non-Business URLs. | ||
| Collect Active Directory Group Information | Enabled / Disabled | Use the Enable / Disable toggle switch to enable or disable the collection of AD Group data. The current staus of the category setting is displayed beneath the category setting heading, as shown in the screenshots. | |
| Collect from AD Device Groups | |||
| All AD Device Groups, and non-Domain devices | If this option is selected, user activity is collected from all AD Device Groups and non-Domain devices. | ||
| Only selected AD Device Groups | If this option is selected, the collection of user activity is limited to the selected AD Device Groups. | ||
| Collect from AD User Groups | |||
| All AD User Groups, and non-Domain users | If this option is selected, user activity is collected from all AD User Groups and non-Domain users. | ||
| Only selected AD User Groups | If this option is selected, the collection of user activity is limited to the selected AD User Groups. | ||
| Collect Individual User Information | Enabled / Disabled | Use the Enable / Disable toggle switch to enable or disable the collection of individual user data. Enabling this setting allows the collection of the user name and SID for each foreground application and URL domain. The current staus of the category setting is displayed beneath the category setting heading, as shown in the screenshots. | |
| Only Collect During Local Business Hours | Enabled / Disabled | Use the Enable / Disable toggle switch to enable or disable the limitation of user activity data collection to local business hours. The current staus of the category setting is displayed beneath the category setting heading, as shown in the screenshots. |
Export End User Activity data for further analysis
Click the Export to CSV button on the End User Activity dashboard to export the end user activity data into a spreadsheet for further processing and analysis.