Note
30 days after your organization migrated to the new data pipeline, data will be displayed in the Environment Assessment report.
The Environment Assessment report shows a summary of resource consumption in your environment that you can use to optimize resource allocations and identify problematic usage trends. You can view aggregated resource usage data and activity trends from the previous 30 days, updated to the minute that the report is generated. The report calculates the daily data aggregation according to UTC. Use it to gain a holistic understanding of how the different consumers of resources in your organization relate to one another.
Use the report to answer questions such as:
Where are the physical CPUs least optimally allocated among the virtual CPUs in my organization.?
Which users consumed more than P95 (95th percentile) of CPU usage trends in the past month?
Which days had the most P100 (maximum of average) CPU usage?
Which applications are used most in my organization?
Has any abnormal resource usage occurred in the past month?
To learn more about the Environment Assessment report, watch our video.
Report Data
The report provides the following functionalities to view data:
Donut Charts
If you place your cursor on one of the colored circles of a donut chart, the value in the center of the chart changes to the quantity of items represented by that color.
Chart Keys
In addition to explaining the color-coding in charts, you can use select the keys in the charts to show or hide data. If you hover over an item in the key, a popover displays all of the data points for that item.
Report Links
If you hover over a chart and the text changes color, the text links to another report to provide additional details.
Report Parameters
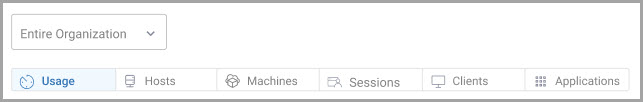
By default, data for your entire organization is selected.
You can select to display the data according to Usage, Hosts, Machines, Sessions, Clients, or Applications views. By default, the Usage view is selected.
Aggregate machine data shown in the widgets is only from the managed machines with the ControlUp Agent installed and running. Client data shown in the widgets is only from client devices with the ControlUp Remote DX Agent installed and running.