Explore Microsoft Teams Data
- Print
- DarkLight
- PDF
Explore Microsoft Teams Data
- Print
- DarkLight
- PDF
Article Summary
Share feedback
Thanks for sharing your feedback!
Important
You must use Windows Agent version 2.12.9 or higher to collect Agent data from the latest version of Microsoft Teams. Learn more about Agent version control.
Use the UC&C - Unified Communications & Collaboration module to monitor Microsoft Teams usage and call quality.
If you haven't set up the Microsoft Teams integration in Edge DX, visit Microsoft Teams Integration.
Access Microsoft Teams dashboard in Edge DX
If you access Edge DX using ControlUp's DEX platform (app.controlup.com), click on the UC&C icon and select Teams from the dropdown.
If you access Edge DX using the web UI or by direct tenant URL (<tenant-name>.sip.controlup.com), go to Dashboards > Teams Dashboard.
Call Data
The Teams dashboard displays data related to the calls made by your end-users via Microsoft Teams, during the time period of the displayed Date Range.
Approximately 15 minutes after a call ends, Edge DX is notified by Microsoft's API that a call/meeting has been completed. Edge DX then retrieves the call data, and it appears in the Teams dashboard.
The call data is displayed in a grid in the lower display of the dashboard, while in the upper display of the dashboard, several widgets provide graphic displays highlighting particular call data.
Refer to the table below for information about the grid display of the call data.
Refer to Teams Dashboard Widgets below for details about the widgets displayed in the upper display of the dashboard.
Refer to Filter the Call Data for information about applying filters to the call data, so that you can see particular data on the Teams dashboard.
Call Data - Grid Display
See the table below for more information about the Teams call data displayed in the grid in the lower display of the Teams dashboard:
| Call Data Parameter (Column heading in grid display) | Details | Additional Actions | Parameter Field Name (for filtering purposes - See Filter the Call Data for details) |
|---|---|---|---|
| Call ID | Identification number of the call. (This number is the last section of the call ID received from the Microsoft API.) | See Call Data Drill Down below for more details..png)
| call_id |
| Type | Type of the call:
| type | |
| Caller / Org | The initiator of the call. | organizer_displayname | |
| Participants | Number of participants in the call. | participants_count | |
| Score | The score shown for the call is a measure of the overall quality of the call. | Hover over the score to see detailed data behind the call score. | |
| Start Time | Start time of the call. | start_datetime | |
| End Time | End time of the call. | end_datetime | |
| Duration (mm:ss) | Duration of the call. | duration_ms | |
| Audio | A headset icon indicates that the call included audio communication. The color of the headset icon indicates the quality of the audio communication during the call:
| Hover over the headset icon to see the average MOS score for the call audio. | had_audio |
| Video | A video icon indicates that the call included video communication. The color of the video icon indicates the quality of the video communication during the call:
| Hover over the video icon to see details about the call video quality. | had_video |
| Screen Share | A screen sharing icon indicates that the call included screen sharing. The color of the screen sharing icon indicates the quality of the screen sharing during the call:
| Hover over the screen sharing icon to see details about the call screen sharing quality.  | had_videoscreensharing |
Filter the Call Data
Filter Call Data According to Time of Call
Click the displayed Date Range to select a different time period for which you want to see data about your end-users' Teams calls. The data displayed in both the widgets in the upper display of the Teams page, as well as the grid in the lower display of the Teams page, is filtered and updated according to the selected Date Range.
Filter Call Data According to Call Data Parameters
Filter the Call Data Displayed in the Upper Display Widgets
To filter the call data displayed in the upper display widgets, perform the following steps:
- Click Add Filters.
.png) The Add Filters dialog box opens.
The Add Filters dialog box opens.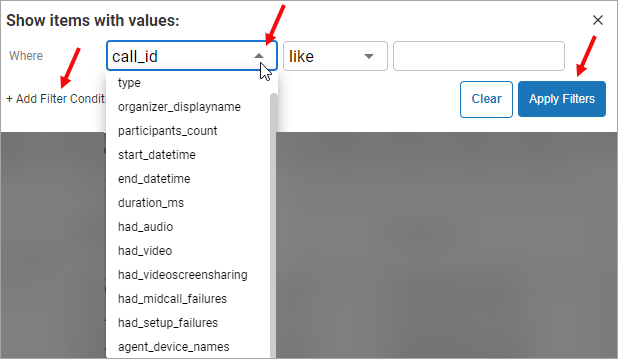
- Select a call data parameter from the menu in the dialog box and set filtering criteria for it. (See details about the call data parameters in the above table.)
- Click Add Filter Condition to add an additional filtering condition.
- Click Apply Filters.
.png) The Add Filters dialog box opens.
The Add Filters dialog box opens.
Note
The filters applied using the Add Filters icon in the upper display as described above affect the data displayed in the upper display widgets only, and do not affect the data displayed in the lower display grid.
Filter the Call Data Displayed in the Lower Display Grid
To filter the call data displayed in the lower display grid, use the filtering tools below the column headings.
Note
The filters applied in the lower display grid using using the filtering tools below the column headings affect the data displayed in the lower display grid only, and do not affect the data displayed in the upper display widgets.
Teams Dashboard Widgets
In the upper display of the Teams dashboard, the following widgets provide graphical displays of particular call data:
See below for additional information about each widget.
The Teams Widget
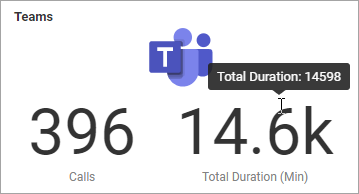
The Teams widget displays the following data about the calls that took place during the Date Range displayed on the Teams dashboard:
- Total number of Calls.
- Total Duration, in minutes, of all of the Calls. (Hover over the displayed Total Duration figure to see a precise figure for the total duration of calls, if the total duration displayed is an approximate figure.)

The Score Over Time Widget
The Score Over Time widget displays a line graph charting the average Teams Experience scores for time intervals during the Date Range displayed on the Teams dashboard:
Hover over a data point to see how many calls took place during the time interval, and the details of the contributing metrics which resulted in the final average score displayed on the line graph.
The Feedback Widget
The Feedback widget displays feedback about call quality volunteered by call participants at the end of a call. When a call ends, participants are asked to rate call quality on a scale of 1 to 5 by selecting a corresponding number of stars. Typically, many call participants do not bother to rate their call, so it is to be expected that the number of rated calls is less than the total number of calls which took place during the Date Range displayed on the Teams dashboard.
The Feedback widget displays the following data about calls which took place during the Teams dashboard Date Range for which participants provided feedback data.
- The number appearing in the center of the widget gauge is the total number of feedback responses provided by call participants.
- The widget gauge is divided into sections which are:
- color-coded according to call quality (Excellent, Good, Fair and Bad)
- proportionally sized according to the number of calls rated for each quality type as a fraction of the total number of rated calls.
Hover over any of the gauge sections to see the figures behind the graphical representation in the gauge (i.e., the number of rated calls for each quality type).
The Call Distribution by Experience Widget
The Call Distribution by Experience widget displays a bar graph showing a breakdown of call experience (poor, average and excellent) for time intervals during the Date Range displayed on the Teams dashboard. The number of call setup failures and mid-call failures which occurred during each time interval is also shown on the graph.
Hover over a data point on the graph to see the figures behind the graphical display (i.e., the number of calls for each experience type, number of call setup failures and mid-call failures). 
The Meetings Widget
The Meetings widget displays a graphical representation of the overall success of the Teams calls which took place during the Date Range displayed on the Teams dashboard.

Success bar - The portion of the total Calls (shown in the Teams widget) which were successful, are represented by a proportionally-sized green bar along the Success bar. Hover over the green bar to see the number of successful calls.
Failures bar - The portion of the total Calls (shown in the Teams widget) which failed, are represented by a proportionally-sized red bar along the Failures bar. Hover over the red bar to see the number of failed calls. 
Call Data Drill Down
In the call data grid display in the lower display of the Teams dashboard, you have the following options to drill down into the displayed call data to view more detailed data, as shown in the screenshot below:
- Click the arrow to the left of a Call ID number to expand the call and see additional call participant data. Refer to Expand a Call below for additional information.
- Click the location pin icon to the right of a Call ID number to see the call location displayed on a map. Refer to Map View below for additional information.
- Click the Call ID number to open the Call Details page and see more details about the call. Refer to Call Details page below for additional information.
.png)
Expand a Call
Click the arrow to the left of a Call ID number to expand the call and view the following additional call information:
- Call Participant Experience Gauge
- The total number of call participants is shown in the center of the call participant experience gauge.
- The call participant experience gauge is color-coded to reflect the call quality experienced by the call participants. Hover over the gauge to see a breakdown of the data behind the graphic display.
- Call Participants - All of the participants in the call are listed.
- Participants are listed by name, if they are members of the organization. A participant who is not a member of the organization is listed as an External Caller or Anonymous.
- Duplicate listings of participants can occur, especially if a participant left the call and then rejoined the call.
- Click on a participant name to drill down to the Call Details page.
Call Details Page
From the Teams dashboard, drill down to the Call Details page to see more details about a call, in one of the following ways:
- Click a Call ID Number.
- In the expanded call view, click a call participant.
The Call Details page displays call, device and connection details, as well as minute by minute information on the call connection and experience quality, as shown in the screenshot and described in the table below:.png)
| Call Details Page Section | Call Initiator Data | Call Recipient (Mid-transmission or Endpoint) Data | Call Quality Data | General Call Data |
|---|---|---|---|---|
| Top Section - Call Participant Details |
|
|
|
|
| 2nd Section - Connection Details | Details about the Call Initiator's Device:
| Details about the Call Recipient's Device or Microsoft data center:
| If a device is using a Wifi connection, and Wifi signal strength information is available, the average Wifi signal strength is displayed alongside a Wifi signal strength icon, as a percentage of the maximum possible strength. | |
| 3rd Section - Connected Device Details |
|
|
| |
| Bottom Section - Minute Charts |
|
| For Call Initiator and Call Recipient:
|
Map View
In the call data grid display in the lower display of the Teams dashboard, click the location pin icon to the right of a Call ID number to see a map view of the call..png)
The map view is displayed..png)
In the map view, location markers indicate the geographic locations of the call participants.
For meetings, the locations of the Microsoft Azure Data Centers to which the call connected are also shown.
Perform the following actions to explore call data details in the map view:
- Click on a location marker to display lines connecting between:
- Call participant locations for peer to peer calls.
- Call participant locations to Azure data center locations for meetings.
If multiple call participants are having issues in one location, that could be an indication that they are sharing a common internet connection / ISP which is experiencing problems, or that the Azure data center they are connected to is experiencing problems..png)
In the upper righthand corner of the map view, the following action options are available, as shown in the screenshot below:.png)
- Select a call session metric from the menu (Audio, Video or Screen Sharing Quality) to display the metric for each caller participant on the map.
- Click on the grid view or globe icon to switch between the grid view and the map view.
- Click Show All Meetings to show every meeting on the map.
.png)
.png)
UC&C Reports - Teams
Access UC&C Reports via the main navigation.
Under Reports > Unified Communications, click the report you want to view.
Teams Summary Report
The Teams Summary Report provides summarized information about Microsoft Teams usage in your organization.
Export data from the Teams Summary Report
To export data from the Teams Summary Report, follow the procedure for one of the export options shown in the table below:
| Teams Summary Report Section and Data | Data Export Procedure |
|---|---|
| Upper section - graphic display widgets |
|
| Lower section - grid data | Click Export to CSV to export the grid data to a csv file. |
.png)
.png)
Was this article helpful?