The Active Processes tab gives you a live, detailed view of every application and background service running on the device. You can use this view to identify resource-hogging applications, spot unauthorized processes, or terminate frozen programs.
Prerequisites
This feature is supported only for Windows devices with Agent version 2.17.7 or higher.
Access the Active Processes tab
In Devices, drill down into the details for a specific device and select the Active Processes tab. Note that only one ControlUp user can access the Active Processes tab for a specific device at any given time.
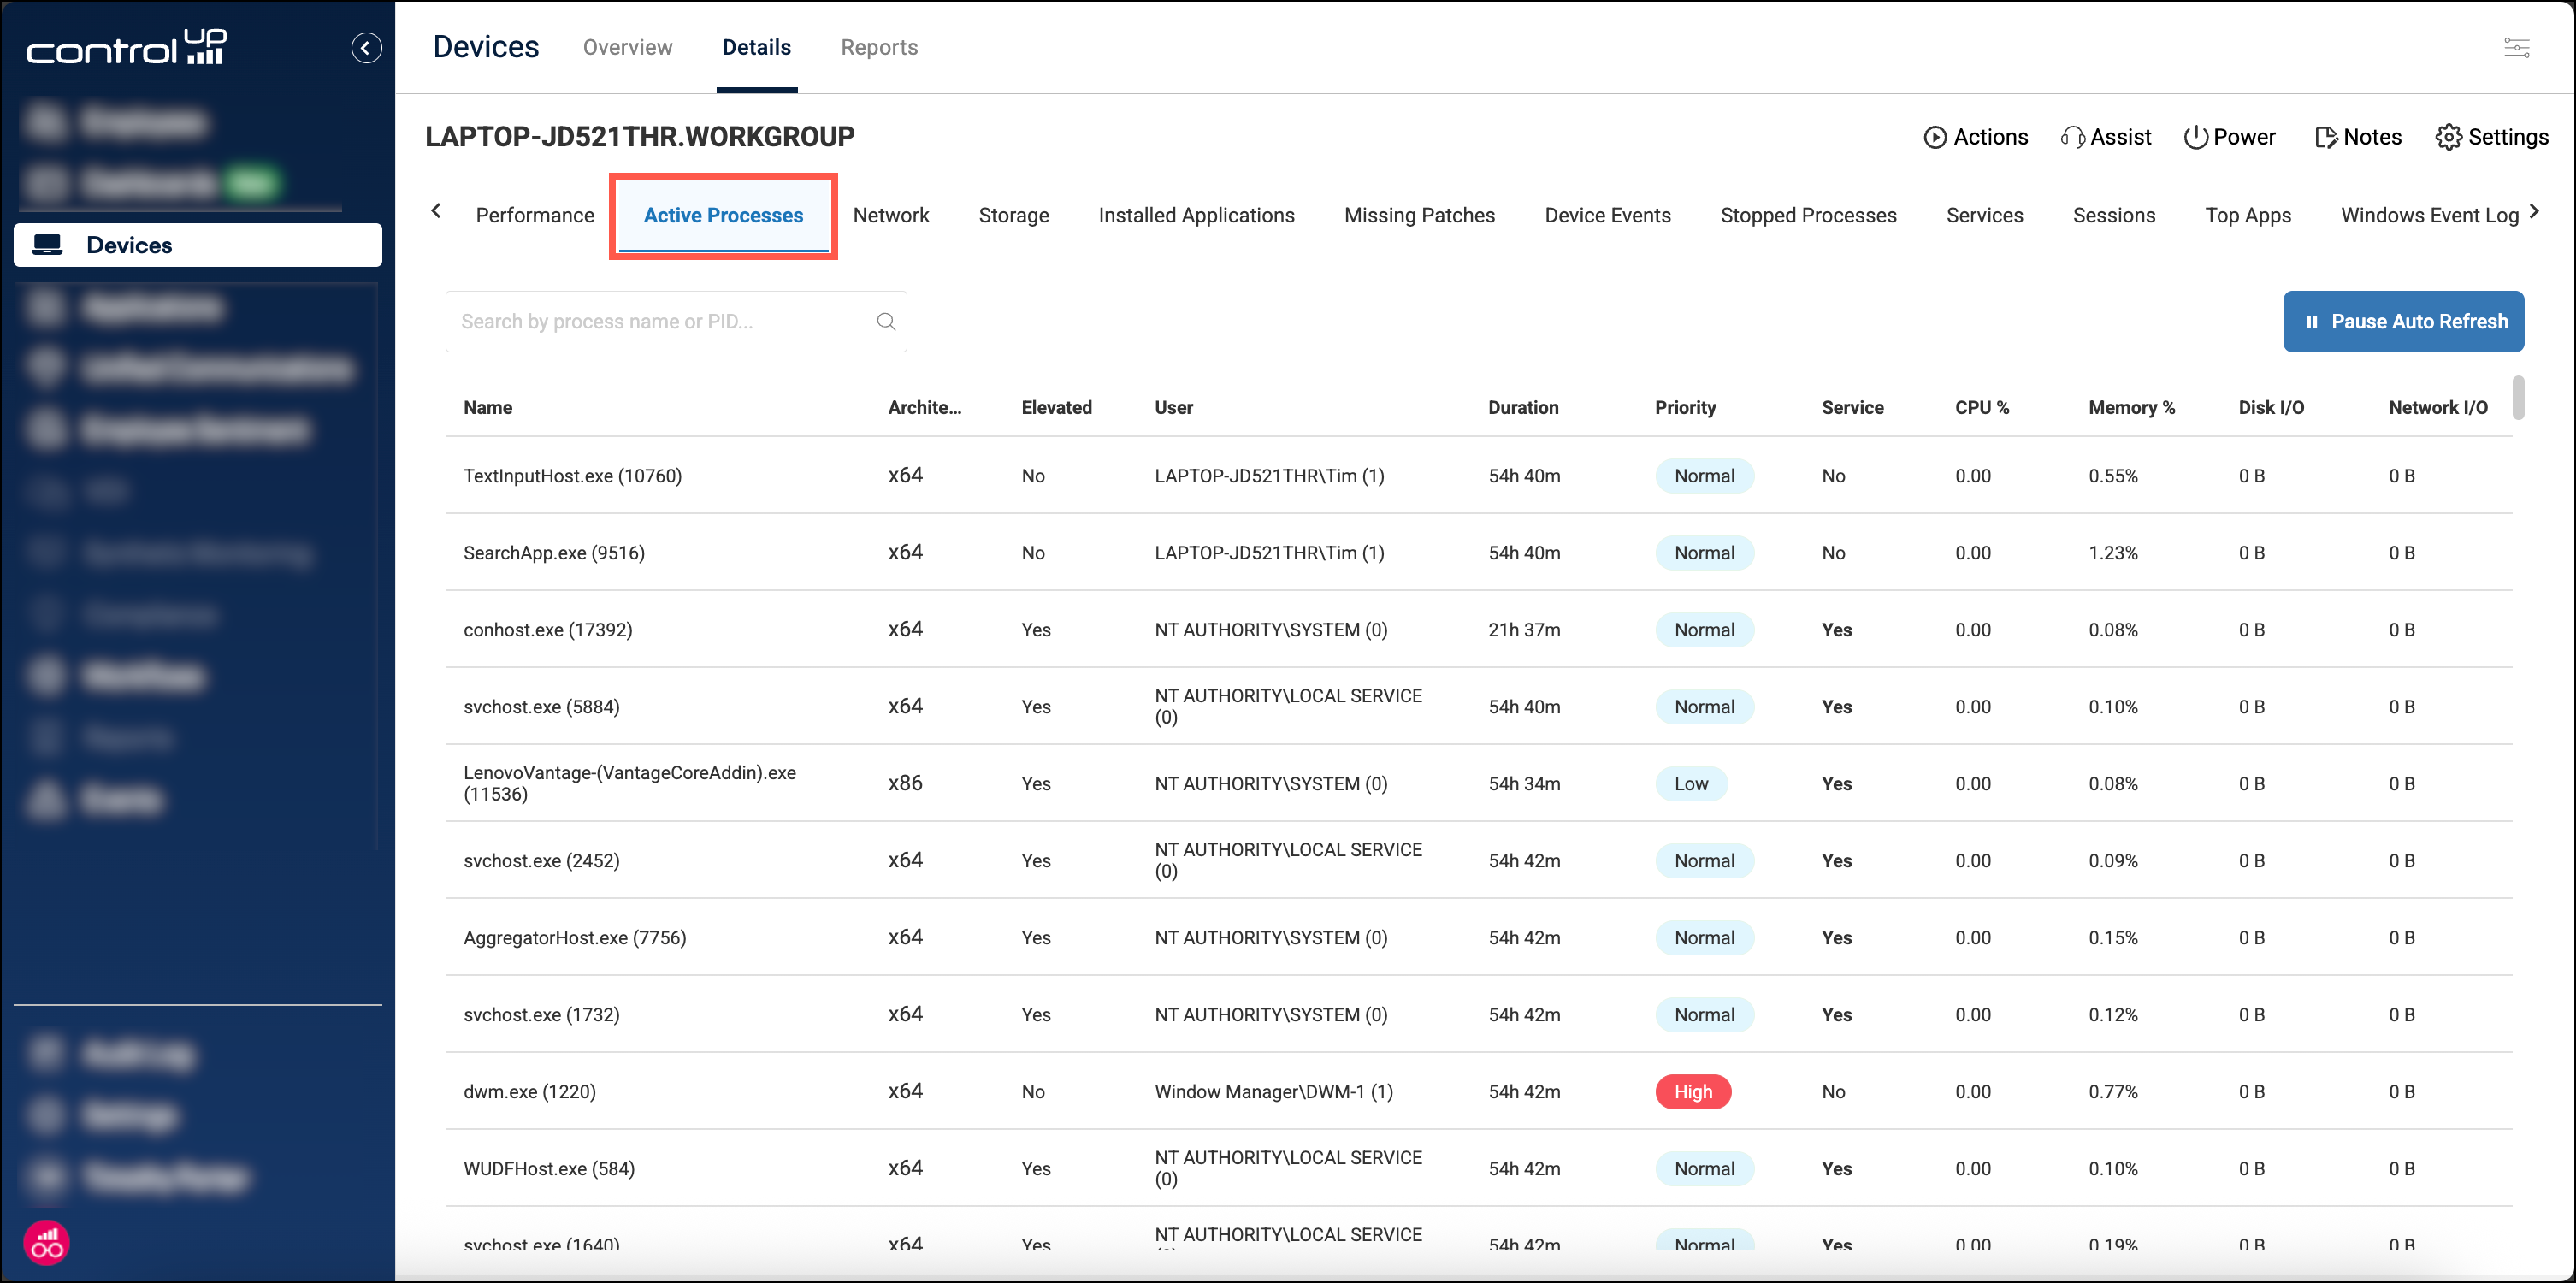
The main view lists all running processes. You can search for specific items using the search bar (supports Process Name or PID).
Columns
Name: Displays the executable name followed by its Process ID (PID) (e.g.,
chrome.exe (12968)).Architecture: Indicates if the process is 32-bit (x86) or 64-bit (x64).
Elevated: Displays
Yesif the process is running with administrative privileges.User: Shows the username running the process, followed by the Session ID in parentheses.
Duration: The time the process has been running.
Priority: The CPU priority level for the process. You can click on a process and drill down into the Threads tab to see the exact priority value.
Service: Whether the process is running as a service.
Resource Usage: Real-time metrics for CPU %, Memory %, Disk I/O, and Network I/O.
Tip: Read vs. Write I/O The table displays total I/O activity. To distinguish between input and output, hover over the Disk I/O or Network I/O values. A tooltip will appear showing the specific Read vs. Write breakdown.
Management actions
You can interact directly with processes from the main table:
Pause Auto Refresh: Click the button in the top-right to freeze the data for easier analysis.
Context Menu: Right-click on any row to access quick actions:
Copy to Clipboard: Copies the row data for reporting.
End Process: Immediately sends a termination command to the remote device to kill the selected application.
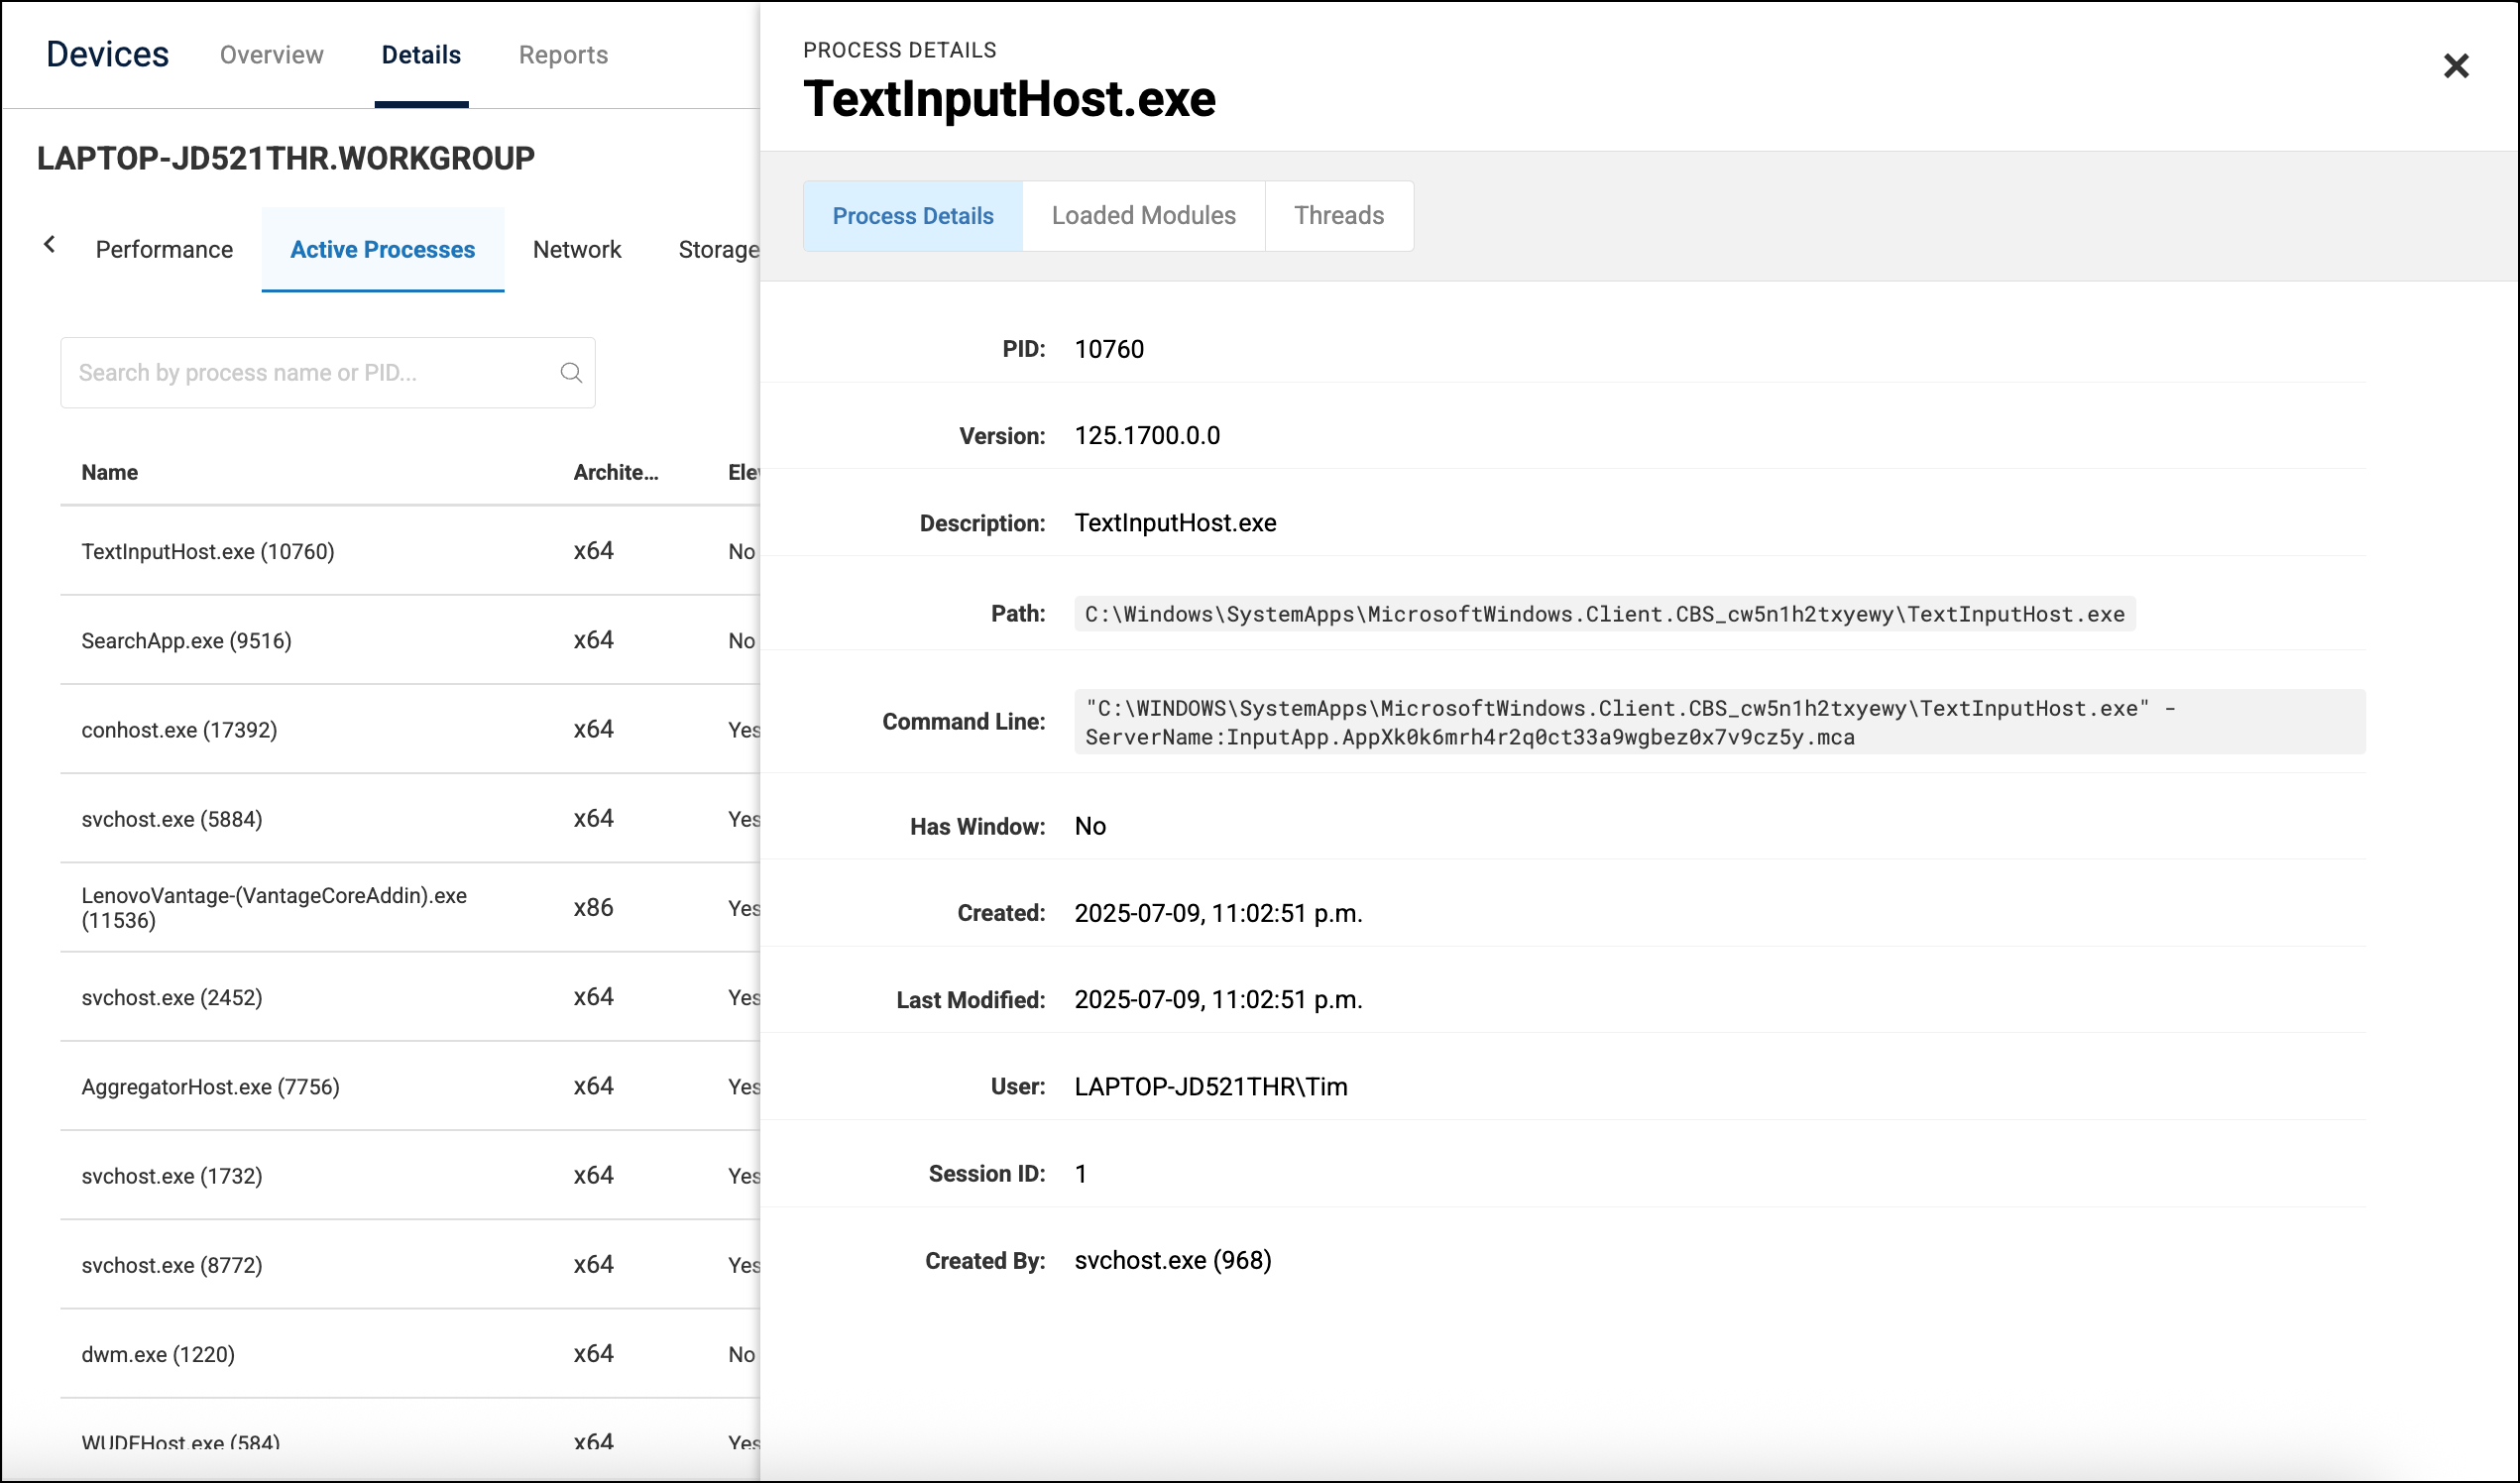
View Details: Opens the advanced process details blade.
Process details (drilldown)
Clicking on any row (or selecting View Details from the right-click menu) displays additional information about the process for advanced troubleshooting:
Process Details: Displays metadata about the executable.
Loaded Modules: Displays a list of all DLLs and modules loaded by the process.
Threads: Displays a granular view of the process’s execution threads.
Known issues
NLS (National Language Support) files do not appear when you drill down into a process’s loaded modules.