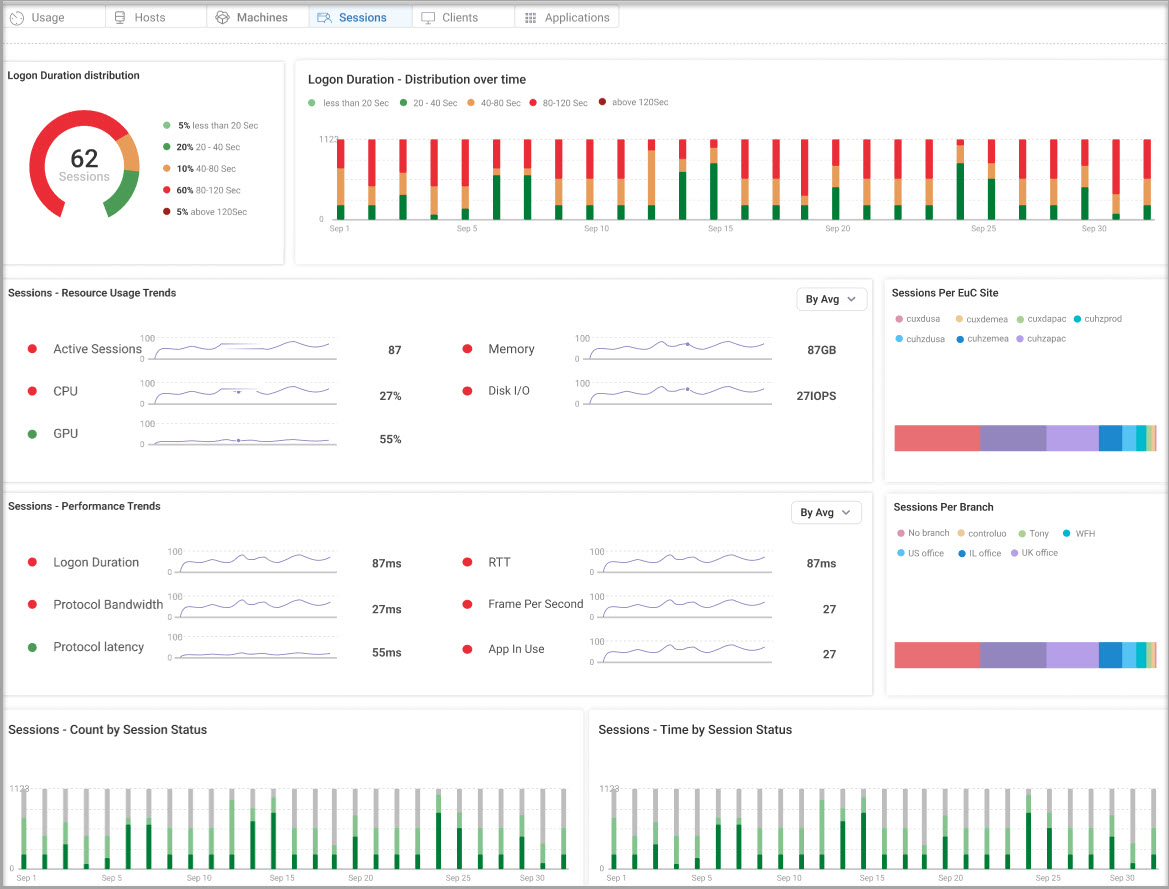
In the Sessions view, the Environment Assessment report shows the following resource consumption details for the user sessions established on machines in the selected folder.

Sessions Widgets.jpg)
- Logon Duration Distribution. Shows total number of sessions and overall logon duration distribution by seconds. Hover over a bar to show the number of sessions for each logon duration. The percentage of sessions are color-coded according to logon duration:
- Light Green: Less than 20 seconds.
- Dark Green: 20-40 seconds.
- Orange: 40-80 seconds.
- Light Red: 80-120 seconds.
- Dark Red: Above 120 seconds.
.jpg)
- Logon Duration Distribution Over Time. Shows distribution of sessions according to logon duration in seconds. Hover over a bar to view the percentage distribution for each day. Click a bar to view the minimum, average, and maximum duration in seconds per day. Click Show Session Activity to open the Session Activity report.

- Sessions Resource Usage Trends. Shows charts of session resource usage trends for Active Sessions, CPU (%), GPU (%), Memory (MB), and Disk I/O (IOPS). You can view the charts according to average, P95, or P100. By default, average is selected. Hover over a data point in a chart to view the score distribution for each day. Click a chart name to open the Session Activity report.

- Sessions Performance Trends. Shows charts of session performance trends for Logon Duration (s), Protocol Bandwidth (Mbps), Protocol Latency (ms), RTT (ms), Frame Per Second, and App In Use. You can view the charts according to average, P95, or P100. By default, average is selected. Hover over a data point in a chart to view the score distribution for each day. Click a chart name to open the Session Activity report.

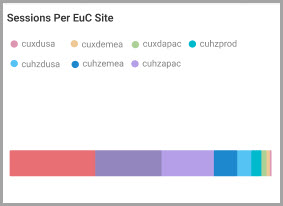
- Sessions Per EUC Site. Shows distribution of sessions according to the EUC site from where the sessions were established. Hover over a bar to show the number of sessions for each EUC site.

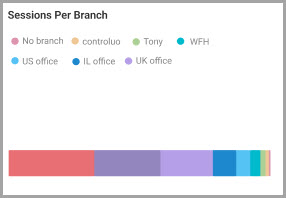
- Sessions Per Branch. Shows distribution of sessions according to the geographical branch location from where the sessions were established. Hover over a bar to show the number of sessions for each branch.

- Sessions - Count by Session Status. Shows total number of sessions per day according to active, idle, disconnected, or other session status. Hover over a bar to show the number of sessions for each status.

- Sessions - Time by Session Status. Shows percentage of time of the total session lifetime according to active, idle, disconnected, or other session status, per day. Hover over a bar to show the number of sessions for each status.