You can access Remote DX data from the Solve Real-Time session grid to view client connection details.
Prerequisites
This feature is available when the following prerequisites are met:
- The Remote DX client is installed on the endpoint device. For details, see Remote DX - Client Device Metrics.
- An active EUC user session is running on the endpoint device through a ControlUp managed machine within the same Solve environment - this means that ControlUp Agent data is available for the session.
When the above prerequisites are met for an endpoint device and a user session running on it, Remote DX data is available for the session.
Real-Time Session Grid
To view Remote DX client metrics on the Discovery page in the real-time grid:
-
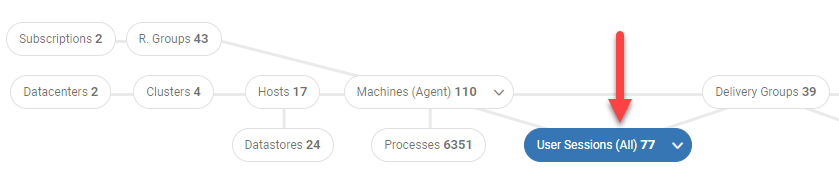
Ensure that you are viewing the User Sessions real-time grid. This is selected in the topology.
-
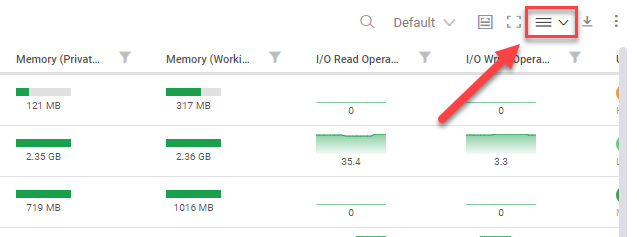
Click on Grid column picker at the top right of the grid.
-
Add columns to the grid relating to Remote DX client metrics. Some of the columns include:
- Client Device Score - This is a connection stress score based on several metrics.
- Client NIC Name
- Client NIC Type
- Client WiFi Signal
- Client Packet Loss
- Client Inactive Time
- Client OS Name
- WiFi Signal
- WiFi SSID
Note that you can use presets to save custom selections of columns to quickly switch between them. For details, see Column Presets.
Client Metrics Overlay
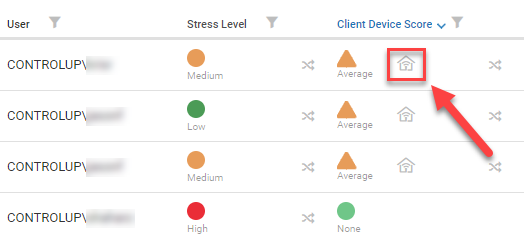
Rather than adding all of the Remote DX metrics to your grid, you can open a client metrics overlay from the Client Device Score column.
Click on the Client Metrics icon  . If the client connection is good, then the icon only appears when you hover over the metric.
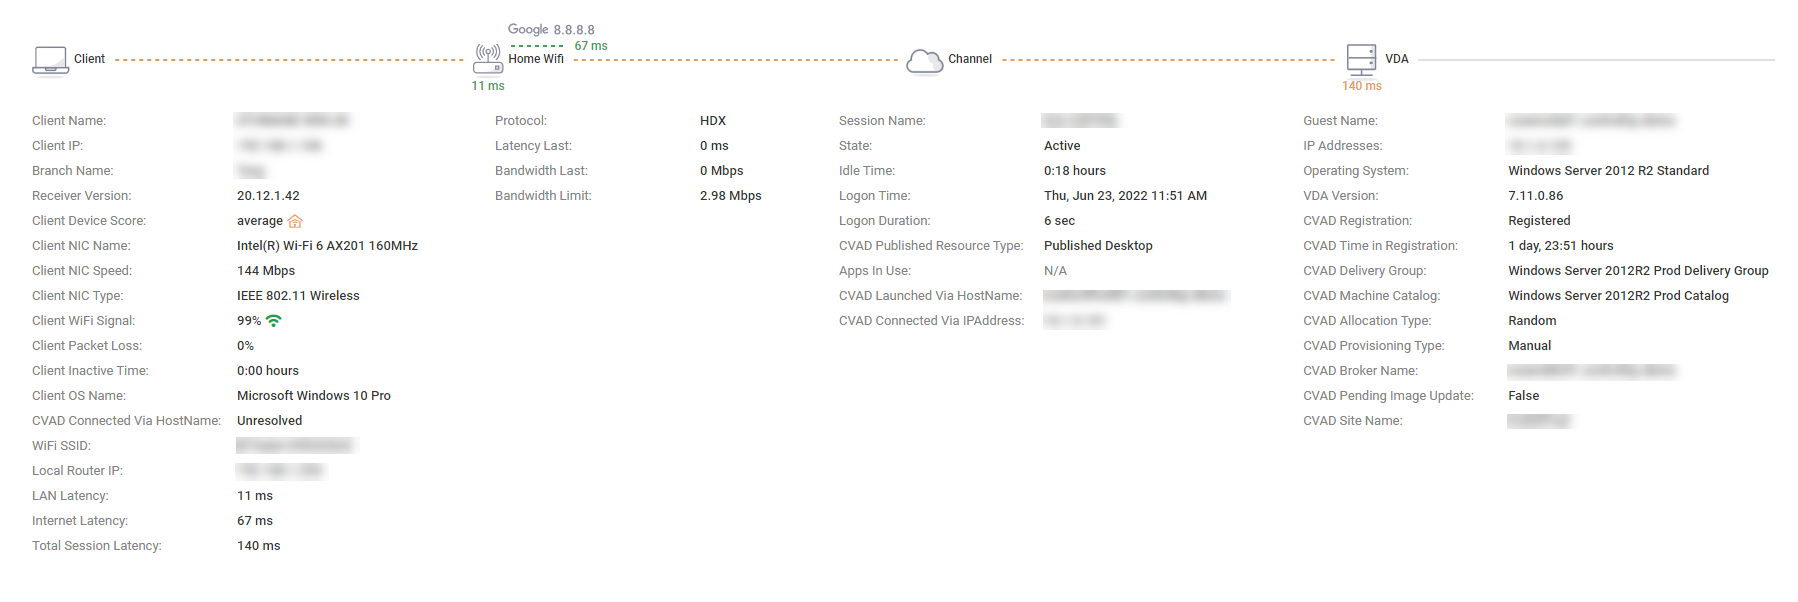
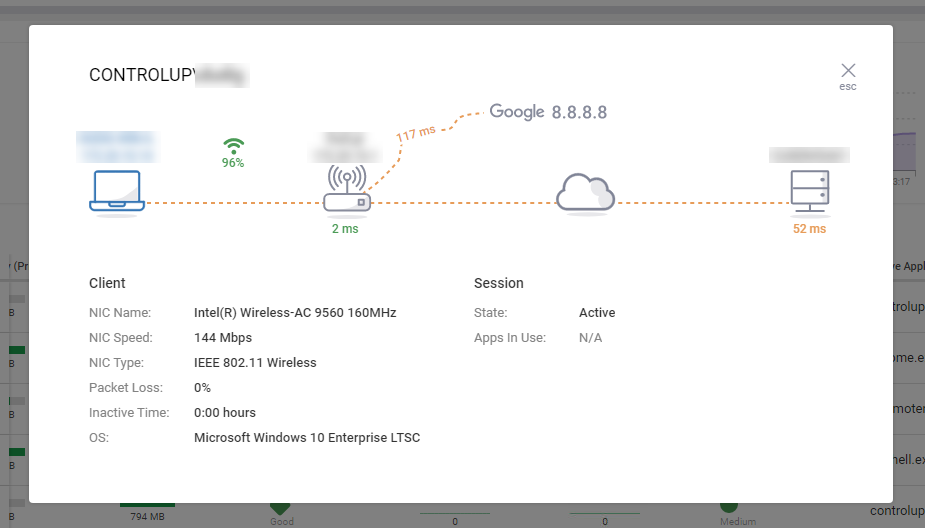
The client metrics overlay appears, showing you the client's connection details.
Session Drilldown
Click on a user session from the real-time grid to drill down into the session. Remote DX data is displayed if it is available for the session.
This feature is only available for Citrix based user sessions.