The VDI and DaaS Audit Log enables you to view the following in you organization's environment:
Changes made to ControlUp’s configuration settings, such as adding a new hypervisor.
Remote operations performed on managed assets through ControlUp, such as rebooting a virtual machine or killing a process on a managed machine.
By default, the Audit Log is configured to enable centralized auditing in ControlUp Hybrid Cloud environments. The Audit Log can upload data to the ControlUp Cloud, or you can configure it to save to a local Syslog server.
Auditing Methods
Group Actions
The auditing is carried out separately for each OBJECT on each TARGET and includes all details and completion status for each Audit Log entry.
Auditing Optimizations
The initialization record contains all data except the output, while the completion record contains the output, status, and the error message if the action failed. To save storage and traffic, the initialization and completion records contain only the relevant data.
In the case of mass/group activity in a public configuration, we have separate Initialized Audit Log entries for each object and one common "Completed" entry for all objects in the group. This is because an action is completed successfully for all objects, or failed for all objects.
The Audit Log documents up to 2,000 automated action executions, per trigger, per minute in your organization.
If the number of executions exceeds the limit, the automated actions run without auditing, even if the enforced mode is enabled. The following Audit Log entry is added to document the exception:
"The amount of Audit Log entries generated by the trigger exceeds the permitted limit and will be silenced for a while."
Real-Time DX Console Version 9.0
After you upgrade your environment to Real-Time DX Console version 9.0 or higher, the actions you run appear as "Initialized" instead of "Completed" status in the log.
Storing the Audit Logs
Logs can be stored in the following ways:
ControlUp Cloud. Default configuration for Hybrid Cloud environments. Once support for the cloud datastore is implemented, it is possible to view an Audit Log report in the web UI. The data is retained in this log for one year after it was first recorded. This option isn't available to configure for ControlUp On-premises (COP) implementations. For complete information on viewing the VDI and DaaS Audit Log, see here.
Example of the Audit Log stored in the web UI: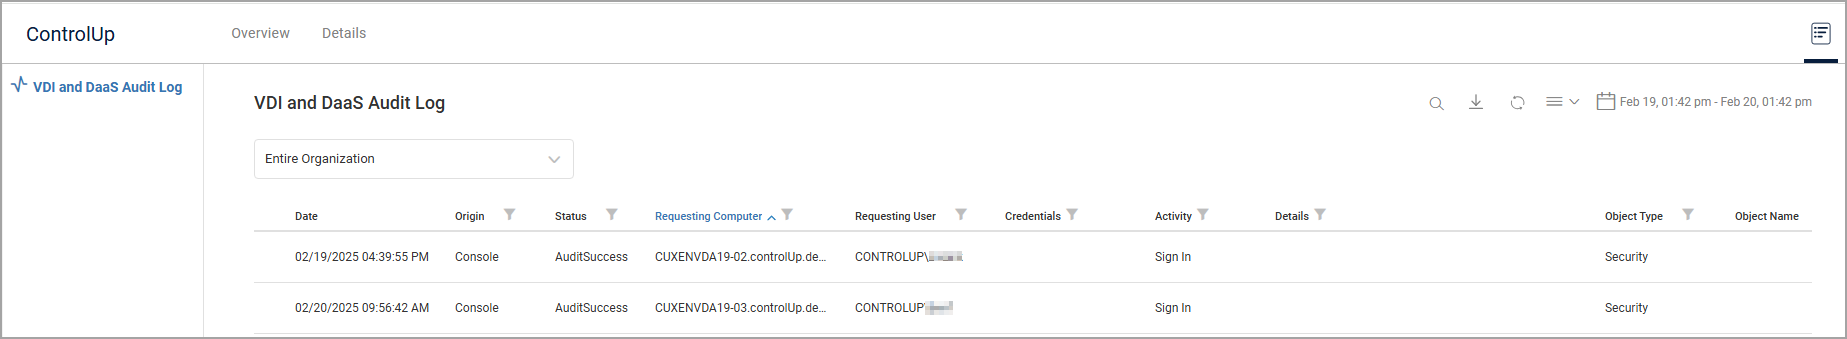
SysLog. The contents of the SysLog datastore can be viewed using any standard Syslog reader (e.g. Splunk). On-premises implementations can only store Audit Logs on their SysLog Servers.
Example of the Audit Log stored on a Syslog Server: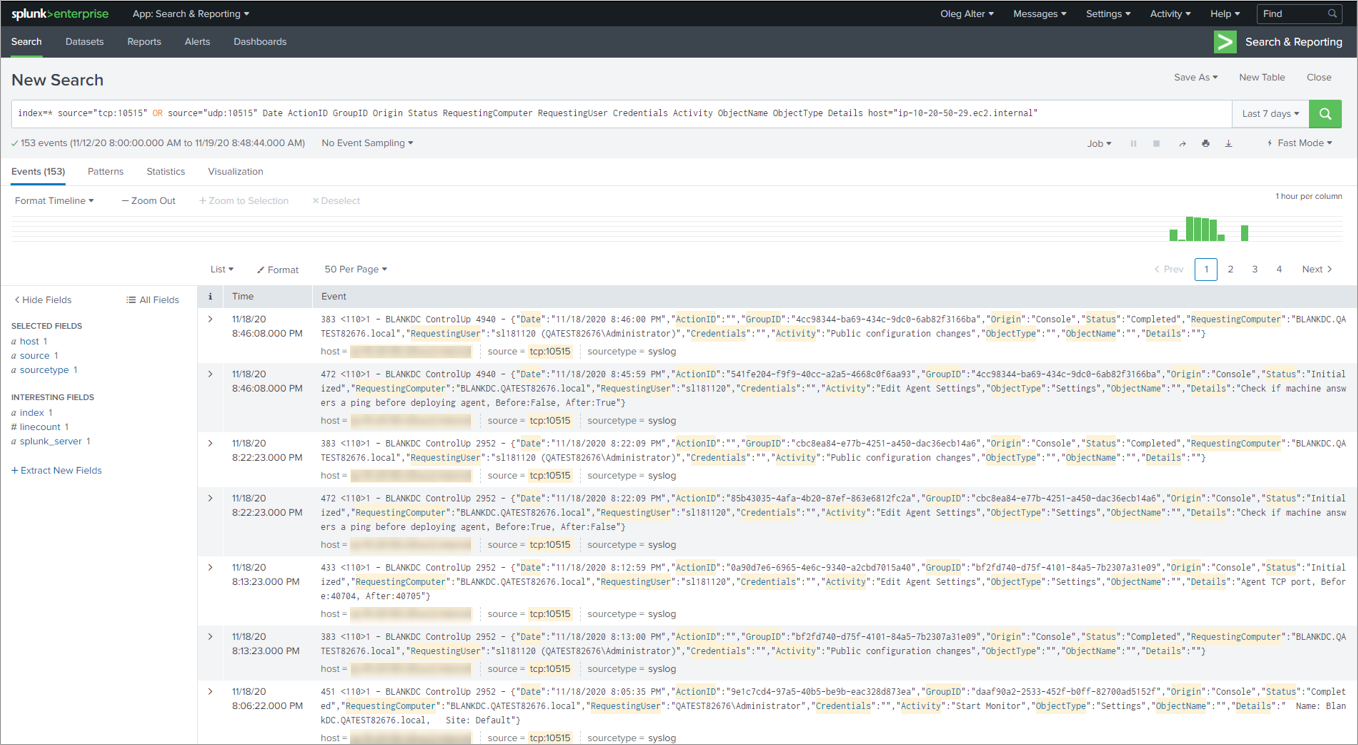
Actions are reported in the Audit Log as two separate entries: once for initialization of the action, and once for completion of the action.
Audit Log Settings
Only the organization owner can modify the Audit Log settings. The organization owner is displayed and managed in the Security Settings pane of the Real-Time DX Console.
To open the Audit Log tab, click Audit Log on the Settings ribbon: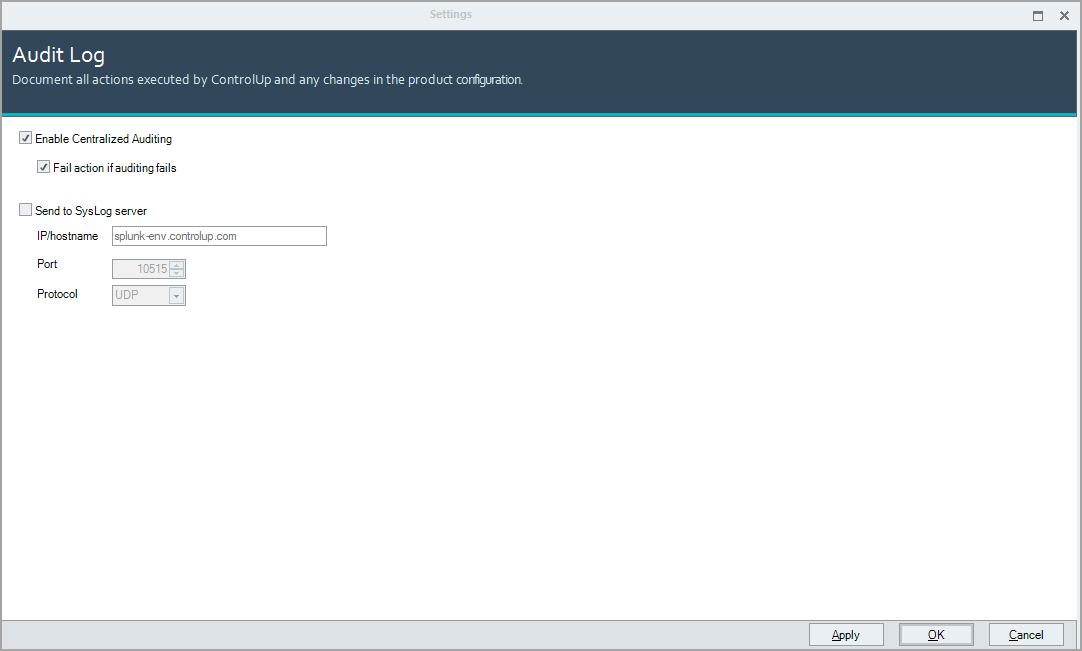
The Audit Log tab includes:
Enable Centralized Auditing. For enabling/disabling the Audit Log data storage in the Hybrid Cloud environment.
Fail action if auditing fails. Enforced mode. Prevents actions from being executed if the auditing wasn't completed properly. Not available in SysLog.
Send to SysLog Server. Enables you to save the auditing records to a SysLog server by entering its:
IP/hostname. Enter the IP address or hostname of the SysLog server.
Port. Enter the port to use to connect to the Syslog server.
Protocol. Select the protocol to use to connect to the SysLog server: UDP or TCP.
After you finish making changes to the settings, click Apply to save the changes or OK to save the changes and close the window.
Audit Logs Data
For each entry in the Audit Log, the following information is stored:
Item | Description |
Date | Date and time of the event. |
Origin | Source of the event (Web client, Console, PowerShell, automated action, web UI, etc.) |
Status | Status of the event (Initialized, Completed, Aborted, Error, etc.) |
Requesting Computer | The hostname or IP address of the machine from which the event was initiated. This can be:
|
Requesting User | User account of the user who initiated the event. |
Credentials | The credentials used to initiate the event. Note: If this is the same as Requesting User, this field is empty. |
Activity | Type of action that was performed (kill a process, add a machine, etc.) |
Details | Additional information that is specific to the command. Each included entity is specified as defined in specific requirements for each command. Each included entity must be specified along with its unique identifier (Process GUID, Session GUID, etc.) |
Object Type | Type of object on which the command was executed (process, session, machine, host, Netscaler, organization, folder, datastore, vDisk, etc.) |
Object Name | Name of object on which the command was executed (machine hostname, hypervisor name, Citrix ADC name, organization name, username, etc.) |
Executing Computer | Machine where the operation was executed (CU Console, CU Monitor, CU Agent). |
Output | Output of the operation. For example, if the action being audited is running a script you can see the output of the script by clicking the icon in this column. |