Feature available only in version 9.2
This article describes monitor features only available in ControlUp Real-Time DX version 9.2.
In Citrix environments, you must register VDAs with a Delivery Controller (DDC) or Cloud Connector (Citrix Cloud) to be available for user sessions. However, when VDAs appear in an unregistered state, they prevent users from connecting. The root cause of these issues isn’t always obvious.
Citrix VDA Registration State Monitoring delivers real-time visibility into VDA registration health, helping you detect and diagnose issues early, reduce troubleshooting time with correlated diagnostics, and minimize disruptions through automated remediation. By configuring incident triggers based on detailed metrics, you can run targeted remediation scripts on VDAs and Delivery Controllers to significantly cut downtime, lower support overhead, and improve end-user experience, accelerating resolution and ensuring your Citrix environment remains reliable and resilient across CVAD and Citrix Cloud.
For prerequisites to use this feature, see here.
To view the metrics for Citrix VDA Registration State Monitoring in the VDI web app, you must upgrade the ControlUp Agent to version 9.2 on all Citrix DDCs/Controllers. For instructions, see here.
What It Does
Real‑time health and status for every VDA.
Dual‑source event collection from VDAs (Citrix Desktop Service) and DDCs (Broker Service/Broker Monitor).
Correlation across VDA/DDC events to pinpoint why a VDA is unregistered.
Automated incident management that tracks the full lifecycle (Open → Closed/Resolved) and calculates resolution duration for SLA reporting.
Trigger & alerting integration for emails, webhooks, scripts, and event log entries, at both the event and incident level.
Supported Environments
Works seamlessly across on-premises CVAD and Citrix Cloud (DaaS) deployments:
CVAD: Events collected directly from Windows Event Logs on VDAs and DDCs.
Citrix Cloud: Registration state retrieved via Citrix Cloud API.
Unified incident tracking across both deployment models.
How It Works
Telemetry Collection & Correlation
Citrix VDA Registration State Monitoring continuously gathers registration‑related telemetry from VDAs and DDCs/Cloud Connectors, correlating signals (e.g., network connectivity, controller availability, configuration mismatches, service failures) to surface the true cause of unregistration.
Automated Incident Creation & Enrichment
CVAD: Incidents are created when failure codes are received from DDC events (e.g., Event ID 10: BrokerRegistrationEnded, Event ID 12: BrokerDeregistered).
Citrix Cloud: Incidents are built from oData API machine data, assembling a RegistrationFailureEventData record from machine snapshot fields.
New events are automatically enriched with VDA details and stored in GlobalRegistrationFailureEvents, then used to create Registration Failure Incidents.
Automated Incident Management
Automatically creates incidents when registration failures are detected.
Tracks Open → Closed/Resolved state with timestamps.
Calculates resolution duration for SLA reporting and trend analysis.
Lifecycle Tracking & Remediation
Incidents are tracked end‑to‑end (Open → Closed/Resolved) with resolution duration calculated for SLA metrics.
You can run PowerShell remediation scripts on VDAs and DDCs, or configure automatic actions triggered by incident properties.
Dual‑Source Event Collection
Monitors 14 VDA event types in real time from the Citrix Desktop Service.
Monitors 30+ DDC event types from Citrix Broker Service and Broker Monitor.
Correlates VDA and DDC signals for comprehensive visibility.
Rich Diagnostic Data for Root Cause Analysis
Captures 30+ deregistration reason codes with clear descriptions and recommended actions.
Records VDA/DDC versions, IP addresses, hostnames.
Associates failures with Delivery Groups, Machine Catalogs, and Citrix Sites.
Retains full event payloads to support root‑cause investigations.
Trigger & Alerting Integration
Configure triggers on individual events and aggregated incidents.
Apply advanced filters on any incident field (e.g., Deregistration Reason, Machine Catalog, Delivery Group).
Execute automated actions: email notifications, webhooks, scripts, event log entries.
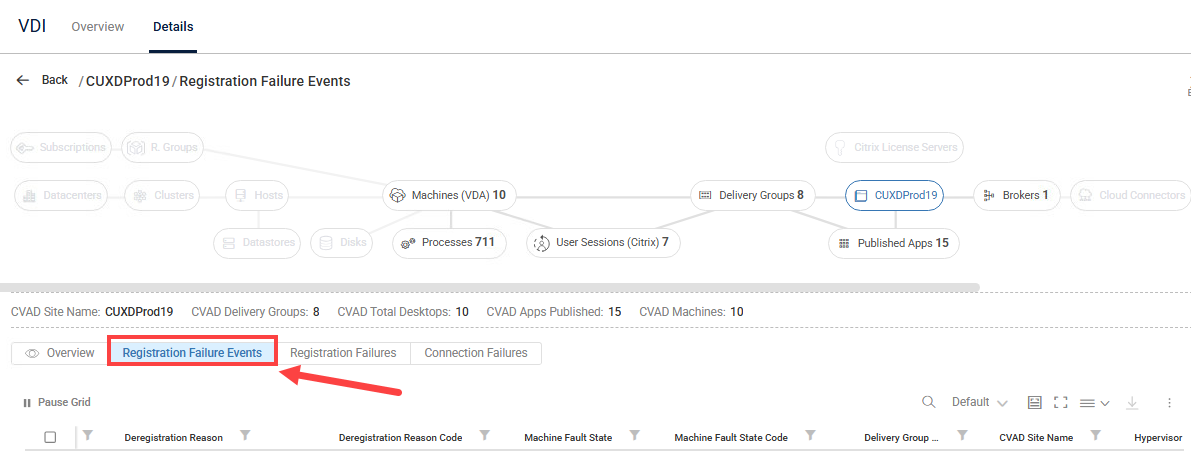
Registration Failure Events Metrics
Registration Failures Events metrics display in the data grid for 1 hour. To view historical metrics for Citrix VDA machine registration state changes, see the Citrix Registration State report.
The Registration Failure Events tab includes the following metrics:
Header | Description |
|---|---|
CVAD Site Name | Name of the Citrix Virtual Apps and Desktops site |
Delivery Controller | Source DDC name (if applicable and parsable) |
Delivery Controller IP | Source DDC IP address (if applicable and parsable) |
Delivery Group Name | Name of the delivery group of the VDA |
Deregistration Reason | Reason why the DDC unregistered the machine |
Deregistration Reason Code | Code for machine deregistration reason |
Details | Parsed specific event details (e.g., innermost exception message) |
Event Category | Initial category deduced from this single event (e.g., 'Connectivity', 'Auth') |
Event Group | Group to which the event belongs |
Event ID | Original Windows Event ID |
Event Level | Event severity ('Information', 'Warning', 'Error') |
Event Payload | JSON representation of original EventData/InsertionStrings |
Event Recording Time (UTC) | Event generation time (UTC) |
Event Time (UTC) | UTC timestamp when the event occurred. This value is derived from the 'EventTime' field in the payload and is automatically converted to Universal Time Coordinated (UTC). |
Hypervisor Name | Name of the Hypervisor used to manage the VDA's virtual machine |
Incident ID | ID of associated incident from the Registration Failures table (see below) |
Insertion Time (UTC) | When this record was inserted into the table (for TTL) |
IP Addresses | IP address of the recording machine |
Machine Catalog Name | Name of the machine catalog associated with the machine |
Machine Fault State | Fault state that prevented the VDA machine’s successful registration with the DDC |
Machine Fault State Code | Code for the machine fault state |
Machine ID | Unique identifier (Machine GUID) |
Machine Name | FQDN of the recording machine |
Provider Name | Provider name (e.g., “Citrix Desktop Service”) |
Rendered Message | Event message text |
Source Name | Name of the event source (e.g. “Citrix Broker Service”) |
Source Type | Source Type (Event Log or Citrix Cloud API) |
Stress Level | Stress Level is a flexible load measure which you can customize using the "Stress Settings" pane. |
VDA Agent Version | Version number of the Citrix Virtual Delivery Agent (VDA) installed on the machine |
VDA IP Addresses | IP address of the VDA that failed to register, from event logs on either the VDA or the DDC |
VDA Machine Name | FQDN of the VDA experiencing a registration failure, as identified in related event logs on either the VDA itself or the DDC |