Explore the core layout and user interface components of the ControlUp Real-Time DX Console.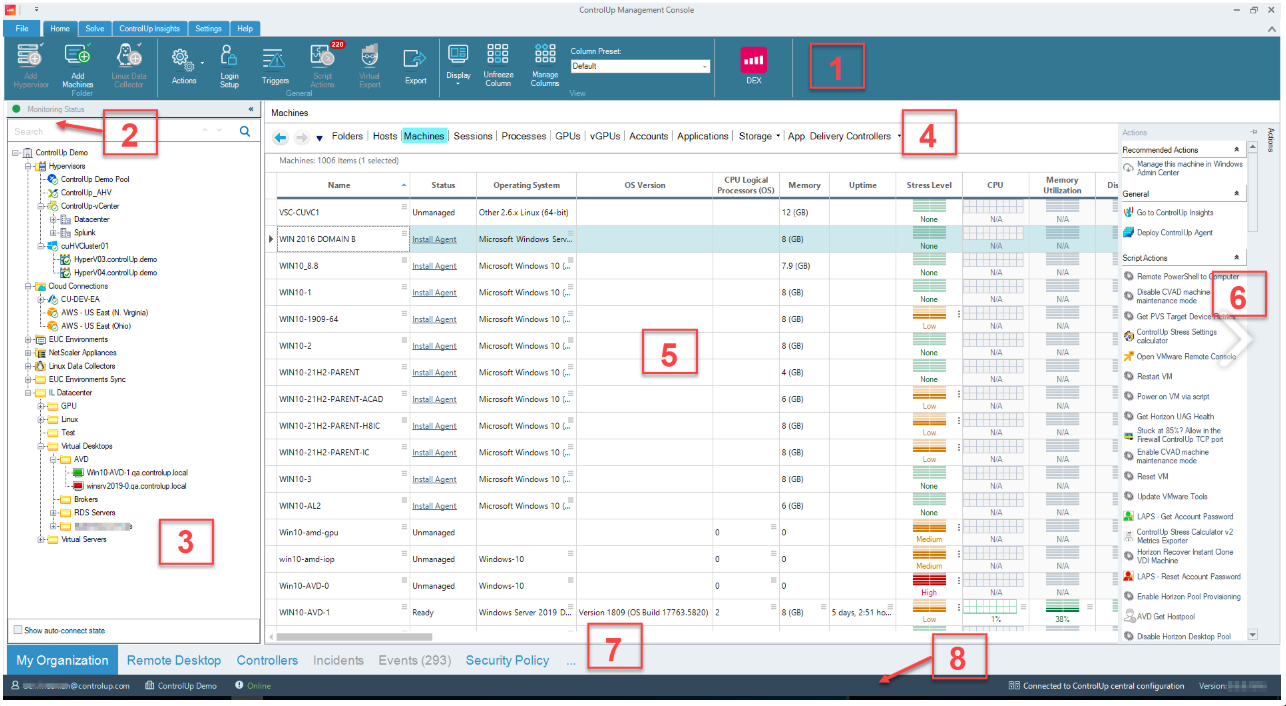
To learn more about the Consule UI, watch our video.
[1] Ribbons
File Menu
Click the File tab to open the File menu, which includes the following options: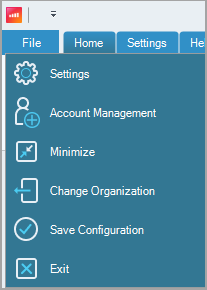
Settings
Click Settings to open the Display Settings dialog box.
Account Management
Click Account Management to open the User Profile dialog box where you can manage common account information such as email address, name, or mobile phone number. Here, you can also manage your mobile devices and enable/disable email alerts.
Minimize
Click Minimize to switch to tray mode, during which the main window is hidden. System tray bubble notifications may still be displayed, according to your settings.
Change Organization
This signs your user out from the current ControlUp session and switches to the Select a ControlUp organization screen.
Save Configuration
Immediately saves the configuration. Especially useful for customers who work offline and need to commit changes to the configuration before exiting the Real-Time Console.
Exit
Terminates your current ControlUp session and closes the application.
Home Ribbon
Here you will find a set of ribbons which include all the actions you will need when working with ControlUp. The buttons on the Home ribbon vary according to the current view and selected objects, while the Settings ribbon and the Help ribbon remain static regardless of the current view.
DEX Button
Lets you open the web UI, configure user permissions and ControlUp Monitors.
Settings Ribbon
Displays different settings such as Agent Settings, the Credentials Store, Triggers and many more.
Help Ribbon
Includes various help options.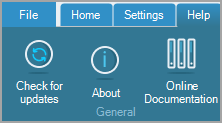
[2] Monitor Panel
In this area you will see the status of all installed instances of your ControlUp Monitor services in your organization. For more information on the ControlUp Monitor refer to ControlUp Monitor.
[3] Organization Tree
A graphical display of all the computers currently added to the console, arranged in folders. There are two methods for managing the tree: right-clicking computers or folders, or by using the Folder area of the Home Ribbon.
For more information regarding ControlUp’s permission delegation capabilities, refer to the Security Policy Pane chapter.
[4] Navigation Bar
Here you can switch between views, navigate between the recently visited views, and enter search queries for the Information Grid.
[5] Real-Time Grid
The main information display area of the console. This high-performance component can quickly display, sort, group, and filter real time information collected from the managed computers.
[6] Actions Panel
Here you can find all available actions for the objects you selected in the information grid. It will display the same actions as if you would right-click the machine.
[7] Panes
By selecting a pane from the bottom left menu, you can switch between ControlUp's different functional areas.
[8] Status Bar
The status bar is a dynamic display that includes the following information regarding your current ControlUp session:
User Name. Your current ControlUp username which you provided when signing in, or a shortened unique derivative of your email address, which can be used for login
Organization Name. The name of your current ControlUp organization
Agent Certificate. Indicates if a certificate for the communication with ControlUp Agents is used
Connection Status. The following values are possible:
Online. You are signed in using ControlUp Hybrid Cloud.
Offline. You are signed in using a ControlUp On-Premises (COP) License File.
Logging in. Displayed briefly following login if Save Password is enabled.
Central Configuration connection status:
Connected. Indicates an active connection to ControlUp Hybrid Cloud.
Connected (with errors). Displayed when some of the changes could not be made to the ControlUp Hybrid Cloud.
Disconnected. Offline, or when communications with Cloud Configuration Servers are disrupted.