This article explains how you can create your own custom dashboards in our VDI App. If you need to create or use custom dashboards for our entire DEX platform, see here.
If you have the Manage Web Application permission in the Security Policy pane, you can publish these dashboards for other users in your organization to access. If you are not an admin, you can create dashboards for your own use.
Our VDI App already includes the following default dashboard options to which you can add your own:
All: Displays metrics for both User Experience and Resources. This is the default display unless you change the default.
User Experience: Displays all the metrics relevant to the end-user computing experience. These can include logon duration, user sessions, etc. You can view the metrics that affect how your users are experiencing your IT environment.
Resources: Displays all the metrics relevant to the infrastructure of your IT environment. These can include CPU usage, memory, network, machines, disk space, etc.
Custom Dashboards
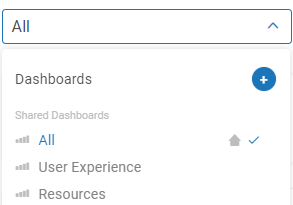
You select from the different available dashboards and create new dashboards from the dropdown menu at the top of the VDI App Dashboard view.
Create a Dashboard
To create a new dashboard:
Click the caret in the dashboard box to open the list of all dashboards.
Click the plus icon.
Type a name into the field that opens at the bottom of the list. Use a name that reflects the data added to this dashboard. Click Enter and you can start adding widgets.
Add a Widget to a Dashboard
You can add widgets to a dashboard to display exactly the data you need to see. You can select from preconfigured widgets or customize your own. Note that you can add a widget to a shared dashboard only if you are a VDI App admin.
To start adding a new widget, go to one of your dashboards and click Add widget.
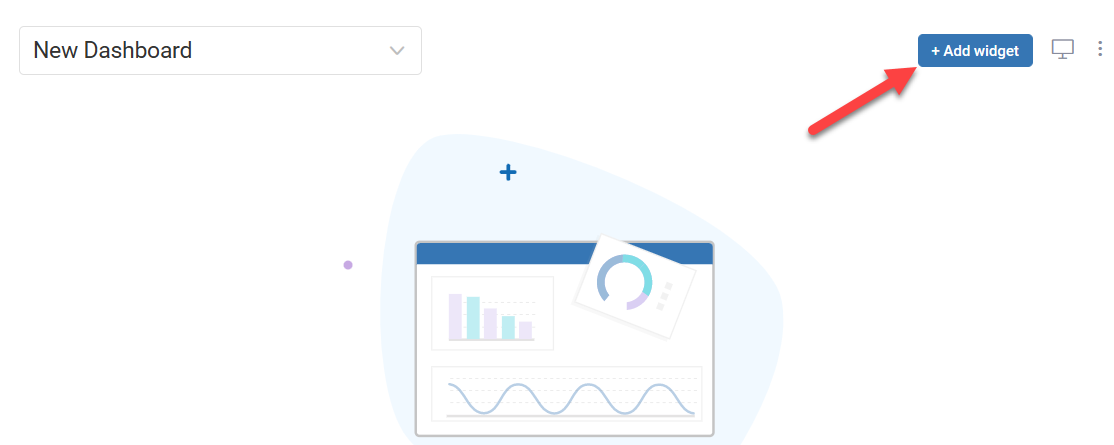
The widget creation window opens. You can choose to add built-in widgets supplied by ControlUp, or you can create your own custom widget..png)
Add a Built-in Widget
ControlUp processes excluded from Top 5 widgets
When viewing the Top 5 widgets, ControlUp processes are excluded from these metrics so you can see what's really going on in your environment without the ControlUp processes that may be running.
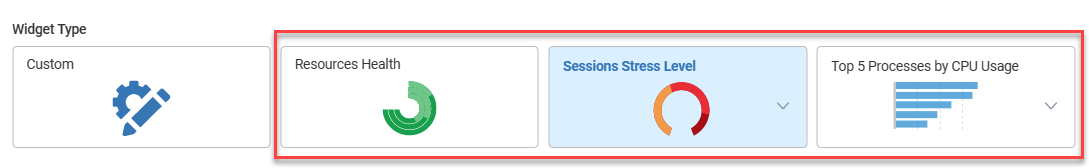
Set the Widget Type to one of the built-in options:
Select the default Scope for the data from your organization tree. The widget shows data from only the selected scope by default. If you highlight a different folder in your organization tree while viewing the dashboard, the scope of the data for this widget changes to the highlighted folder but defaults back to this selected scope if nothing is selected in the tree.
Enter a useful Widget Name that other users can recognize.
Click Add Widget.
Add a Custom Widget
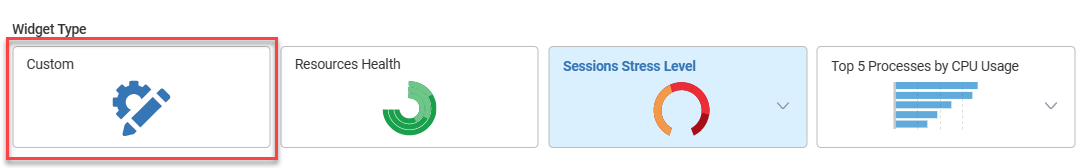
Set the Widget Type to Custom.
Configure the data source for metrics in the widget. The data can come from either a folder in your organization tree, or a resource in your topology.
To show data from a specific folder in your organization tree:
Set the Source to Org tree folder.
Set the Scope of the widget to a specific folder. This is the default scope. If you highlight a different folder while viewing a dashboard, then the scope of the widget updates to the highlighted folder. The widget defaults to the default scope when no folder is highlighted in the dashboard.
Set which topology layer to show when you drill down into the widget using Drill Down To. Drilling down into the widget brings you to the real-time grid on the Discovery page.
Note
To show metrics from your entire organization, select your entire organization (top-level folder) as the Scope.
To show data from a specific resource in your topology (for example, a specific machine):
Set the Source to Topology.
Set the Resource Type.
Set the specific Resource that you want to show in the widget. Drilling down into the widget from the widget brings you directly to this resource on the Discovery page so you can see more information.
Select the Metrics that you want to show in the widget.
Choose how you want to show the metrics by selecting a Visualization type. The available options depend on what data you are showing in the widget.
Enter a useful Widget Name that other users can recognize.
Optionally, if the widget displays a single statistic, resize the widget to a smaller size as needed.
Click Add Widget to save your custom widget.