The Insights database stores data that has been retrieved by ControlUp Monitors, making the information available for future reference. However, because the Monitors retrieve data from the monitored instances very frequently, not all of the data samples they collect can be stored in the Insights' database as raw data. In particular, for metrics that change frequently over time, such as trend data, average values are calculated from the raw data, and only these averages are stored in the database. Thus, for example, if the Monitor retrieves CPU utilization data every three seconds, the Insights database may only store one value for every five-minute period. The value stored will be an average of all the values that the Monitor retrieved during the five-minute period.
When Insights generates a report, it automatically selects the optimal resolution for the report, based on the time range included in the report. For example, the resolution of a report covering the past four hours will be high – five minutes, because the report covers a small enough time frame that there is room to show all the data points available. On the other hand, a report covering an entire year will, of necessity, have a lower resolution – typically, one day.
Standard Data Resolutions in Insights
Insights reports all use the same standard resolutions for given time frames. Time frames in reports can be specified either by selecting a preset time range or by choosing start and end times. Standard resolutions are defined separately for each type of time frame. The resolutions are designed to optimize usability for the time period included in each report.
Preset Time Frames
Preset time frames are defined relative to the day and time on which the report is generated. Longer periods of time have reduced resolution, as follows:
Preset | Data Resolution |
|---|---|
4 hours | 5 minutes |
24 hours | 5 minutes |
1 week | 1 hour |
1 month | 1 hour |
1 year | 1 day |
Note:
Default preset in Platinum website was updated to 1Y.
User-defined Time Ranges
The data resolution for user-defined time ranges depends both on the period of time included in the report and the start date of the report. Reports whose start dates are older may have reduced resolution, regardless of the length of time included in the report, as follows:
Time Period | Start Date | Data Resolution |
|---|---|---|
Up to 3 days (72 hours)
| During any time in the past 30 days | 5 minutes |
More than 30 days ago | 1 hour | |
Between 3 days (more than 72 hours) and 30 days | Any time | 1 hour |
Any length | Any time | 1 day |
How Averages Are Calculated
Averages of data points are calculated for the following time frames:
Five-minute intervals: The data point is the average of all the data points that were retrieved during the five minutes ending at the time of the data point.
Hourly intervals: The data point is the average of all the data points that were retrieved during the hour ending at the time of the data point.
Daily intervals: The data point is the average of all the data points that were retrieved for the specified day (i.e., from 12:00am through the last value retrieved before 12:00am of the following day).
Identifying the Resolution of the Data in a Report
You can see the resolution of the data in the graphs of Insights reports in a number of ways:
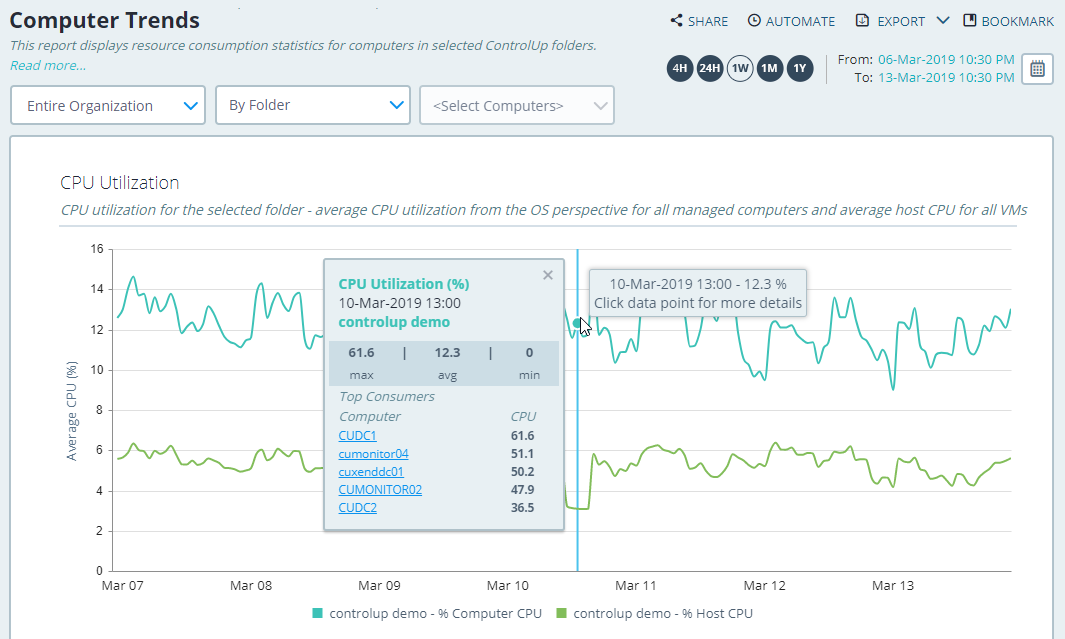
Slowly drag your mouse over points on the graph to open tooltips containing information about each point, including the time represented by the point. If, for example, there is a point for each hour, the resolution is hourly.
.png)
Click adjacent points on the graph. When you click a point, a tooltip opens with information about the point, including the time represented by the point. If, for example, there is a point for each hour, the resolution is hourly.
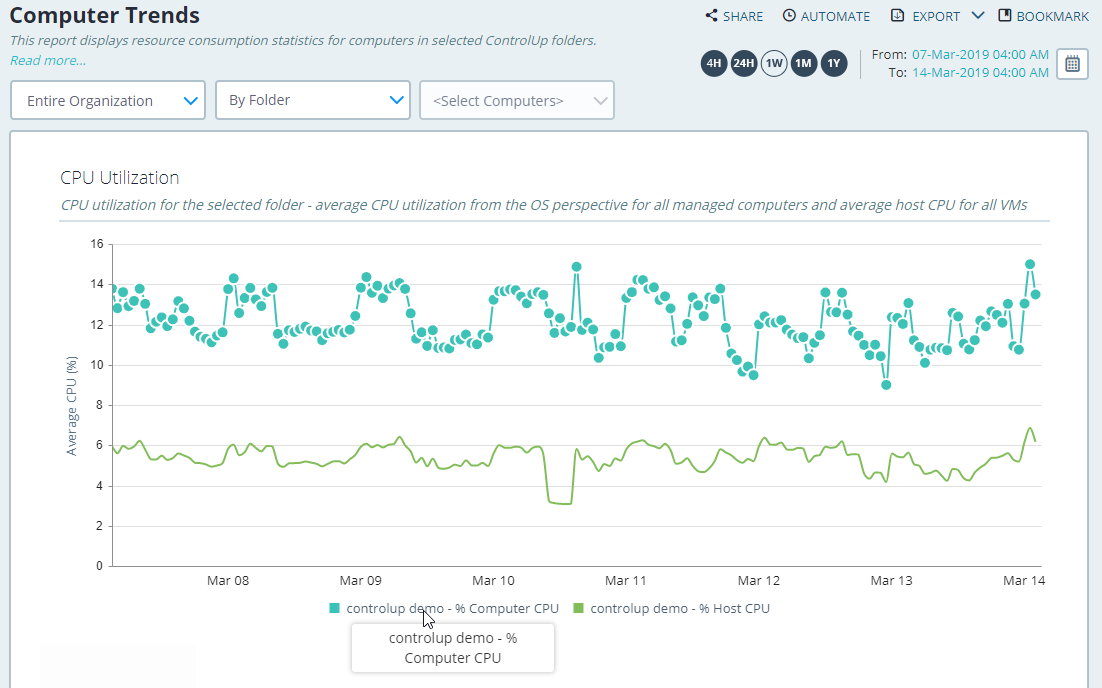
Hover over one of the items in the key below the graph. All the data points for that item will be shown on the graph, enabling you to see how many points there are for each interval marked on the x axis of the graph.
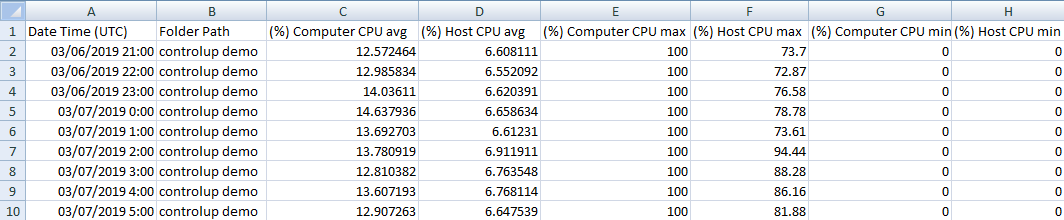
In addition, you can see a list of all of the data points that appear in a report by exporting the report data to a CSV file.