If you haven't set up the Zoom integration for ControlUp, follow the instructions in Zoom Integration.
Access Zoom dashboard in ControlUp
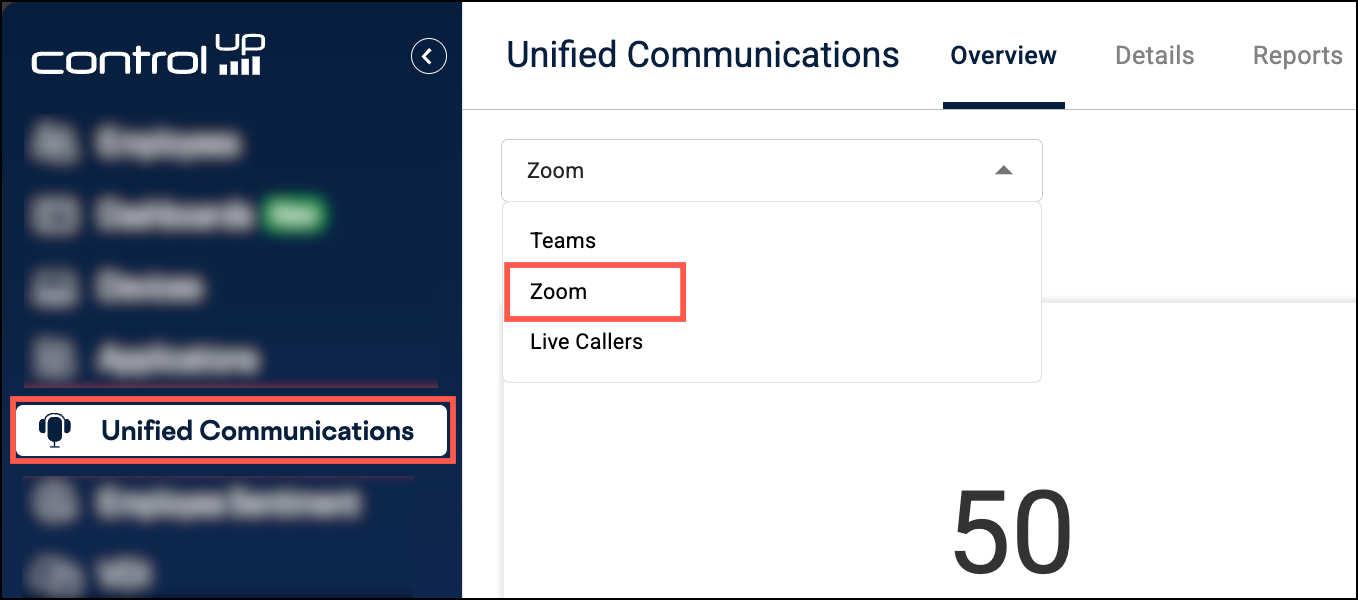
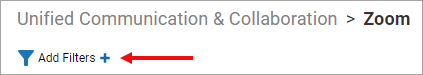
To view Zoom data, go to the Unified Communications section and select Zoom from the dropdown.
Call Data
The Zoom dashboard displays data related to the calls made by your end-users via Zoom, during the time period of the displayed Date Range.
Within a minute or two after a call ends, ControlUp is notified by Zoom's API that a call/meeting has been completed. ControlUp then retrieves the call data, and it appears in the Zoom dashboard.
The call data is displayed in a grid in the lower display of the dashboard, while in the upper display of the dashboard, several widgets provide graphic displays highlighting particular call data.
Refer to the table below for information about the grid display of the call data.
Refer to Zoom Dashboard - Widgets below for details about the widgets displayed in the upper display of the dashboard.
Refer to Filter the Call Data for information about applying filters to the call data, so that you can see particular data on the Zoom dashboard.
Call Data - Grid Display
See the table below for more information about the Zoom call data displayed in the grid in the lower display of the Zoom dashboard:
| Call Data Parameter (Column heading in grid display) | Details | Additional Actions | Parameter Field Name (for filtering purposes - See Filter the Call Data for details) |
|---|---|---|---|
| Call ID | Identification number of the call. (This number is the last section of the call ID received from the Zoom API.) | See Call Data Drill Down below for more details..png)
| call_id |
| Type | Type of the call:
| type | |
| Caller / Org | The initiator of the call. | organizer_displayname | |
| Participants | Number of participants in the call. | participants_count | |
| Score | The score shown for the call is a measure of the overall quality of the call. | Hover over the score to see detailed data behind the call score.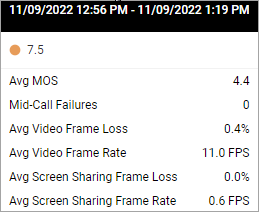 | |
| Start Time | Start time of the call. | start_datetime | |
| End Time | End time of the call. | end_datetime | |
| Duration | Duration of the call. | duration_ms | |
| Audio | A headset icon indicates that the call included audio communication. The color of the headset icon indicates the quality of the audio communication during the call:
| Hover over the headset icon to see the average MOS score for the call audio.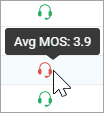 | had_audio |
| Video | A video icon indicates that the call included video communication. The color of the video icon indicates the quality of the video communication during the call:
| Hover over the video icon to see details about the call video quality.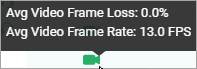 | had_video |
| Screen Share | A screen sharing icon indicates that the call included screen sharing. The color of the screen sharing icon indicates the quality of the screen sharing during the call:
| Hover over the screen sharing icon to see details about the call screen sharing quality.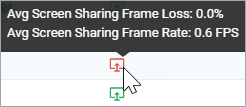 | had_videoscreensharing |
| Recording | A recording icon  indicates that the call was recorded. indicates that the call was recorded. | had_recording | |
| Call Topic | Topic of the call. To view the call topic, you must have the permission View Zoom call topic. | call_topic |
Filter the Call Data
You can filter the call data according to:
Filter Call Data According to Time of Call
Click the displayed Date Range to select a different time period for which you want to see data about your end-users' Zoom calls. The data displayed in both the widgets in the upper display of the Zoom dashboard, as well as the grid in the lower display of the Zoom dashboard, is filtered and updated according to the selected date range.
Filter Call Data According to Call Data Parameters
On the Zoom dashboard, filtering call data according to call data parameters is done separately for:
- Call data displayed in the upper display widgets
- Call data displayed in the lower display grid
Filter the Call Data Displayed in the Upper Display Widgets
To filter the call data displayed in the upper display widgets, perform the following steps:
- Click Add Filters.
 The Add Filters dialog box opens.
.png)
- Select a call data parameter from the menu in the dialog box and set filtering criteria for it. For details about the call data parameters, refer to the above table.
- Click Add Filter Condition to add an additional filtering condition.
- Click Apply Filters.
Filter the Call Data Displayed in the Lower Display Grid
To filter the call data displayed in the lower display grid, use the filtering tools below the column headings.
Zoom Dashboard - Widgets
In the upper display of the Zoom dashboard, the following widgets provide graphical displays of particular call data:
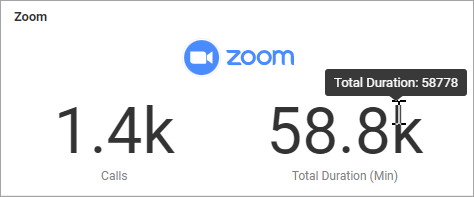
The Zoom Widget
The Zoom widget displays the following data about the calls which took place during the Date Range displayed on the Zoom dashboard.
- Total number of Calls.
- Total Duration, in minutes, of all of the Calls. (Hover over the displayed Total Duration figure to see a precise figure for the total duration of calls, if the total duration displayed is an approximate figure.)
The Score Over Time Widget
The Score Over Time widget displays a line graph charting the average call experience scores for time intervals during the Date Range displayed on the Zoom dashboard.
Hover over a data point to see how many calls took place during the time interval, and the details of the contributing metrics which resulted in the final average score displayed on the line graph.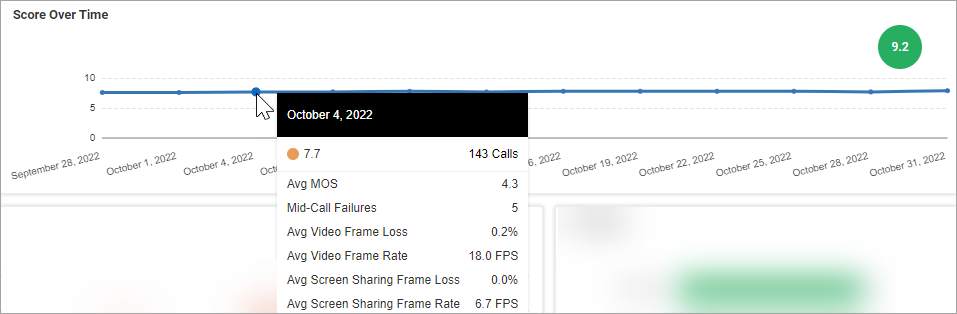
The Call Distribution by Experience Widget
The Call Distribution by Experience widget displays a bar graph showing a breakdown of call experience (poor, average, and excellent) for time intervals during the Date Range displayed on the Zoom dashboard. The number of mid-call failures which occurred during each time interval is also shown on the graph.
Hover over a data point on the graph to see the figures behind the graphical display (i.e., the number of calls for each experience type, and the number of mid-call failures). 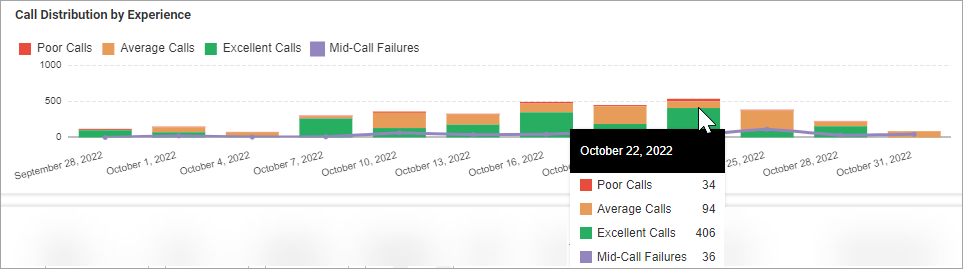
The Meetings Widget
The Meetings widget displays a graphical representation of the overall success of the Zoom calls which took place during the Date Range displayed on the Zoom dashboard.
Success bar - The portion of the total Calls (shown in the Zoom widget) which were successful, are represented by a proportionally-sized green bar along the Success bar. Hover over the green bar to see the number of successful calls.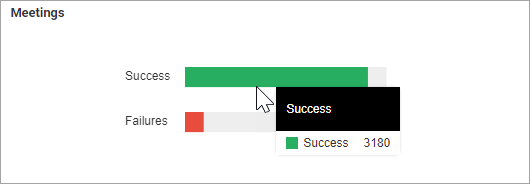
Failures bar - The portion of the total Calls (shown in the Zoom widget) which failed, are represented by a proportionally-sized red bar along the Failures bar. Hover over the red bar to see the number of failed calls.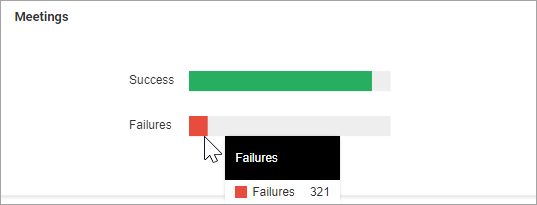
Call Data Drill Down
In the call data grid display in the lower display of the Zoom dashboard, you have the following options to drill down into the displayed call data to view more detailed data, as shown in the screenshot below:
- Click the arrow to the left of a Call ID number to expand the call and see additional call participant data. Refer to Expand a Call below for more information.
- Click the location pin icon to the right of a Call ID number to see the call location displayed on a map. Refer to Map View below for more information.
- Click the Call ID number to open the Call Details page and see more details about the call. Refer to Call Details page below for more information.
.png)
Expand a Call
Click the arrow to the left of a Call ID number to expand the call and view the following additional call information:
- Call Experience Gauge
- The total number of sessions in a call is shown in the center of the call experience gauge.
- The call experience gauge is color-coded to reflect the call quality experienced during the call sessions. Hover over the gauge to see a breakdown of the data behind the graphic display.
- Call Sessions / Participants
- All of the unique sessions within a call are listed. The call participant associated with each call session, and the metrics of each call session are displayed in the grid.
- More than one call session can be listed for one call participant, for example, if a call participant's session gets disconnected, and then the participant rejoins the call.
- Click on a participant name to drill down to the Call Details page for that session.
Call Details
From the Zoom dashboard, drill down to the Call Details page to see more details about a call, in one of the following ways:
- Click a Call ID number.
- In the expanded call view, click a call participant.
The Call Details page displays call, device and connection details, as well as minute by minute information on the call connection and experience quality, as shown in the screenshot and described in the table below: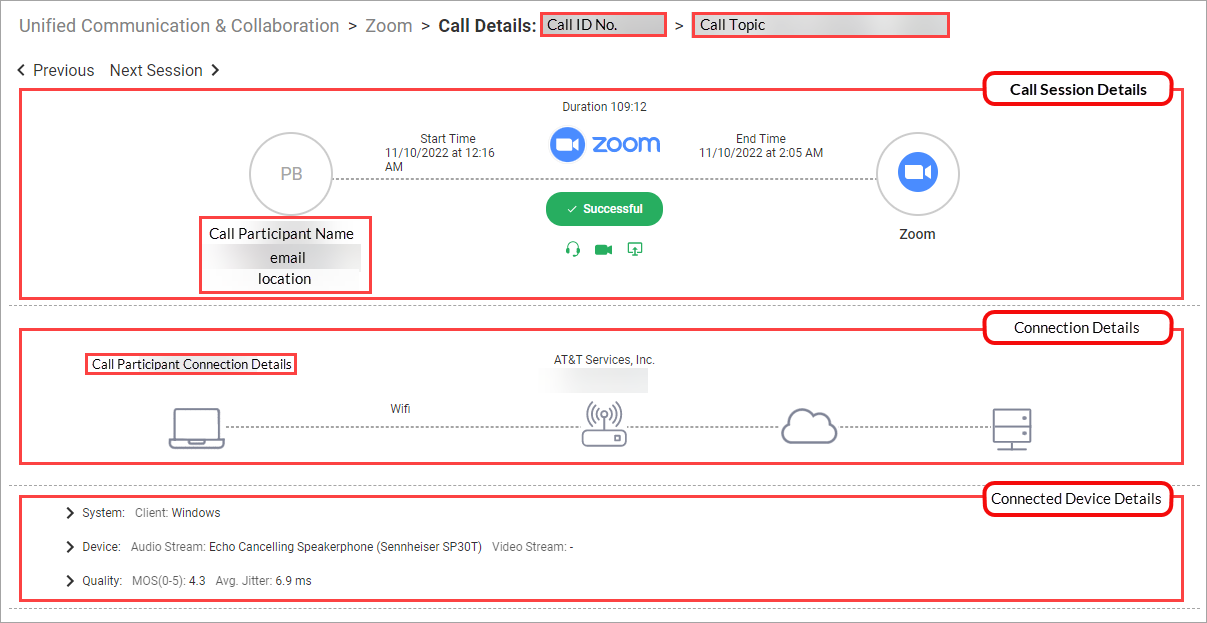
| Call Details Page Section | Call Participant Data | Call Quality Data | General Call Data |
|---|---|---|---|
| Top Section - Call Participant Details | Details about the call participant:
|
|
|
| 2nd Section - Connection Details | Details about the Call Participant's Device:
| ||
| 3rd Section - Connected Device Details |
|
| |
| Bottom Section - Minute Charts |
|
|
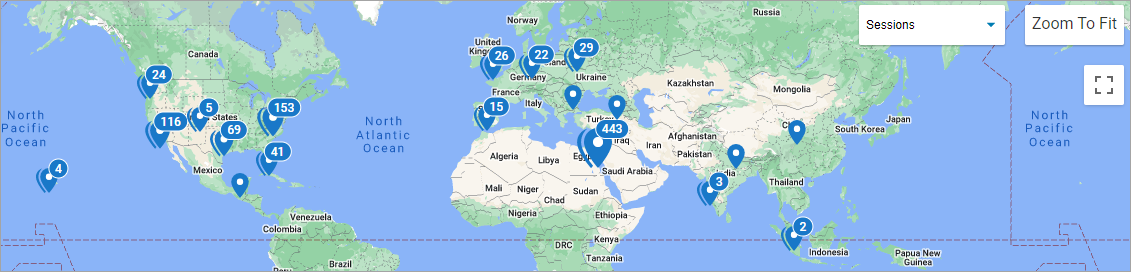
Map View
In the call data grid display in the lower display of the Zoom dashboard, click the location pin icon to the right of a Call ID number to see a map view of the call.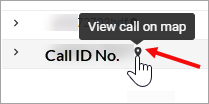
The map view is displayed..png)
In the map view, location markers indicate the geographic locations of the call participants.
Perform the following actions to explore call data details in the map view:
- Click on a location marker to display lines connecting between call participant locations.
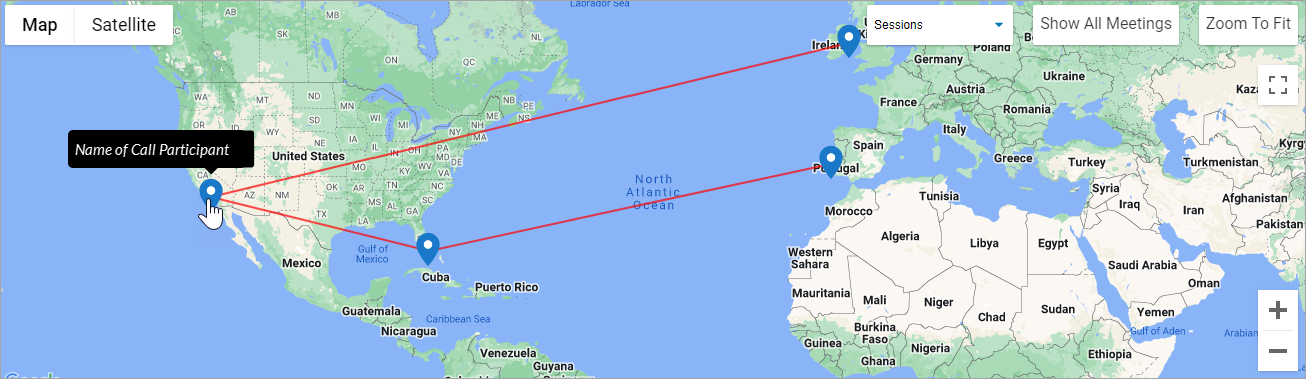
If multiple call participants are having issues in one location, that could be an indication that they are sharing a common internet connection / ISP which is experiencing problems, or that the data center they are connected to is experiencing problems.
In the upper right-hand corner of the map view, the following action options are available, as shown in the screenshot below:.png)
- Select a call session metric from the menu (Audio, Video or Screen Share Quality) to display the metric for each caller participant on the map.
- Click on the grid view or globe icon to switch between the grid view and the map view.
- Click Show All Meetings to show every meeting (which meets the active filter settings) on the map.