Use the Live Callers dashboard to identify users who are currently having a bad call experience in an ongoing Zoom or Microsoft Teams call.
The dashboard shows a list of all devices currently in a call, with real-time data from the ControlUp for Desktops Agent to help you find and troubleshoot call quality problems.
The Zoom/Teams dashboards show more detailed call information from Zoom/Teams APIs, but that information is available only after a call has taken place.
The information in the Live Callers dashboard comes directly from the Agent, allowing you to see real-time UC&C performance.
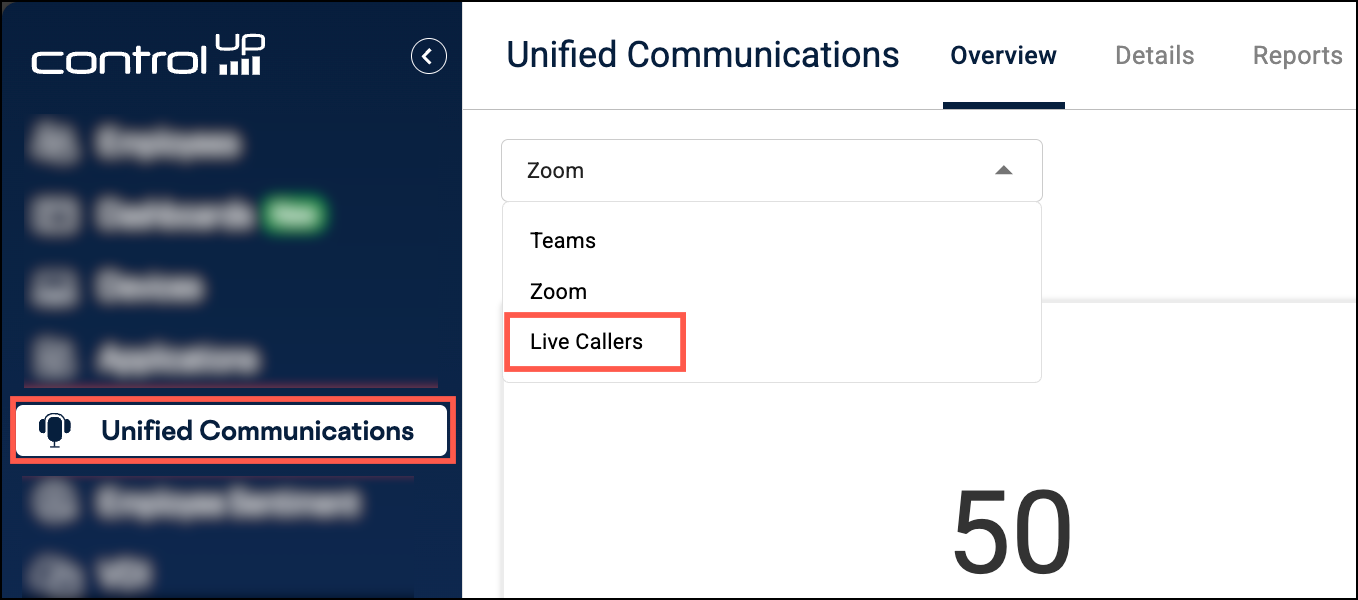
To access the Live Callers Dashboard, go to the Unified Communications section and select Live Callers from the dropdown.
Use Case
To learn more about troubleshooting poor quality Teams Calls, use our interactive use cases guide:
Prerequisites
To use the Live Callers dashboard, you need:
- A license that includes UC&C monitoring. See our pricing page for details.
- ControlUp for Desktops Agent 2.11 or higher installed on the devices. This feature is available only on Windows devices.
Live Call Data
Data from the Agent is used to indicate a device's call performance. This data includes:
- Packet jitter and latency to Zoom or Teams servers.
- MOS (Mean Opinion Score), which is a standardized metric for VoIP call performance. MOS ranges from 1 to 5. A higher score is better.
- CPU utilization of the device.
- Wifi strength and network latency of the device.
You can see these metrics for each device currently in an active call. The metrics are updated every 60 seconds, and you can see a history of these metrics up to one hour in the dashboard. Note that the right side of each graph in the grid contains the most recent data.
If you need more data, you can drill down directly to the device details page by clicking on a device's name.
Call Score
Metrics that can affect call quality are compiled into a Score out of 10. A higher score is better. Hover over a score to see the contributing metrics.
Use the call score to quickly identify users who are likely to be having a bad call experience. As a general guideline, you might start to be concerned about a user's call experience if their score is less than 8.
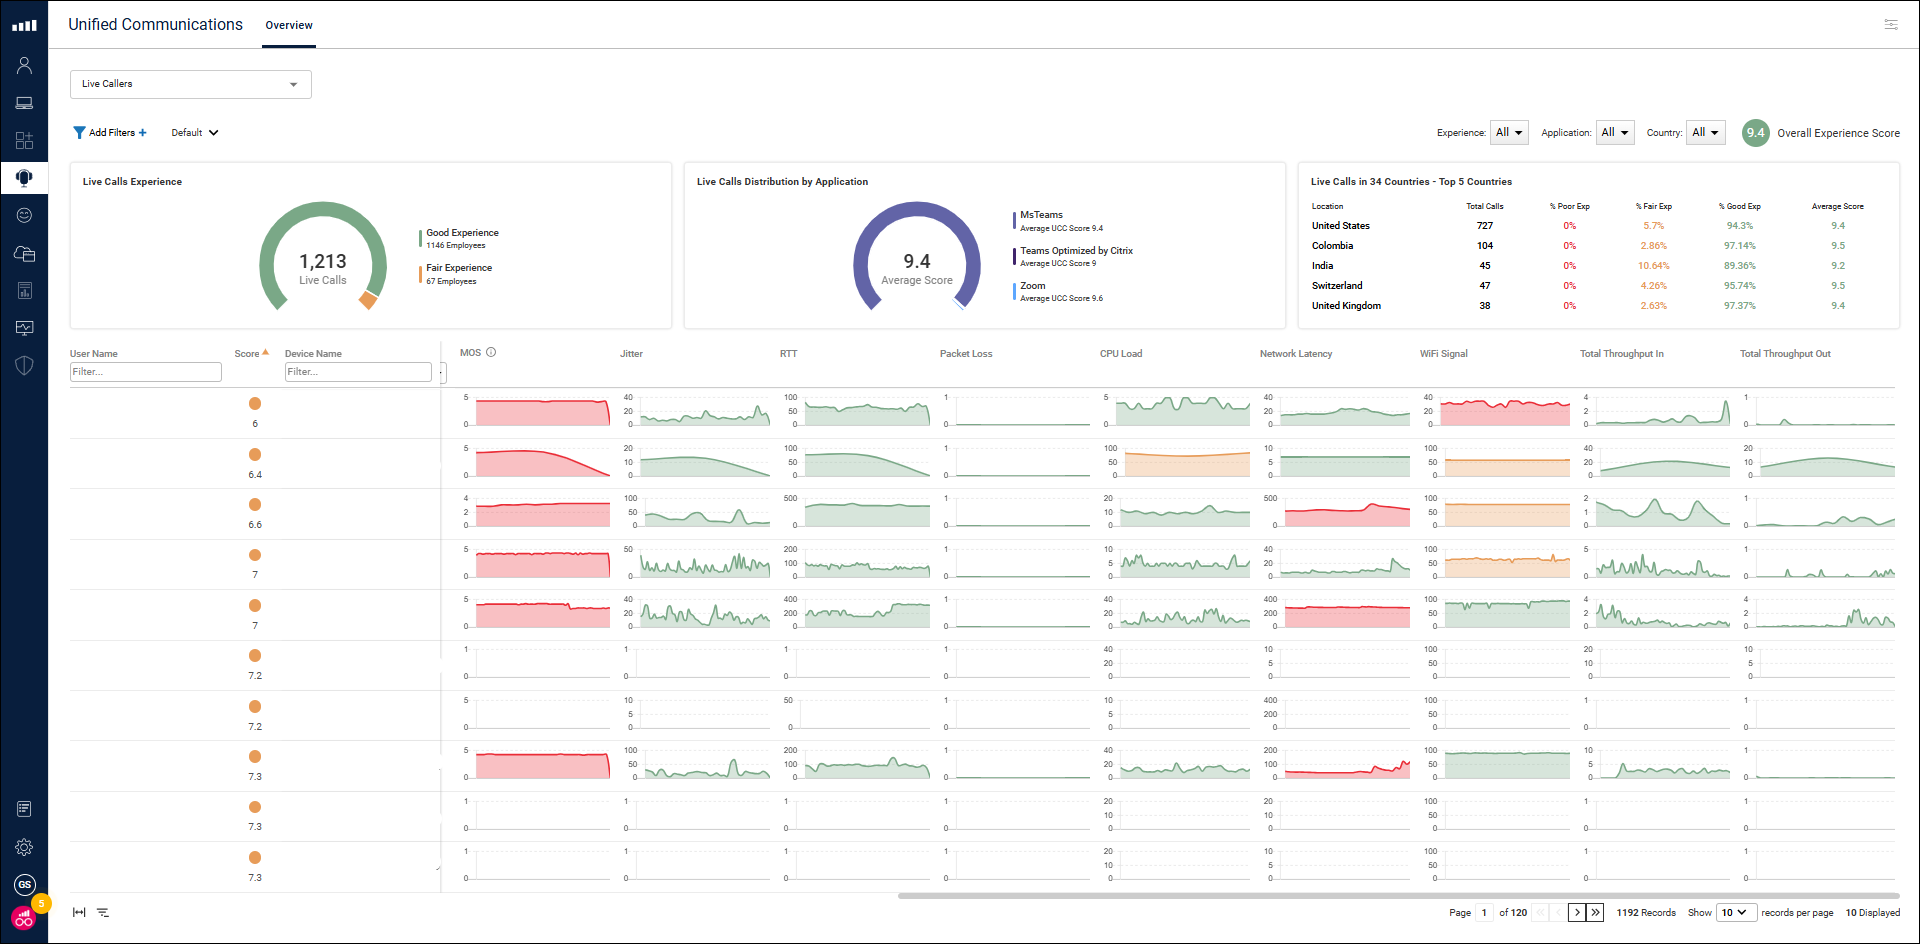
Summary of Calls in Your Environment
See a summary of the current call performance in your environment at the top of the dashboard. You can see:
- The total number of live calls.
- The User Distribution by Experience, which shows the call score distribution across all active calls. Use this distribution to see the overall UC&C performance in your environment.
- The Top Users by Worst Experience, which shows the users in an active call who have the lowest call score. Use this list to see which users are most likely to be currently having a bad call experience.