View and Edit Events
The Details tab displays the list of events with their various metrics.
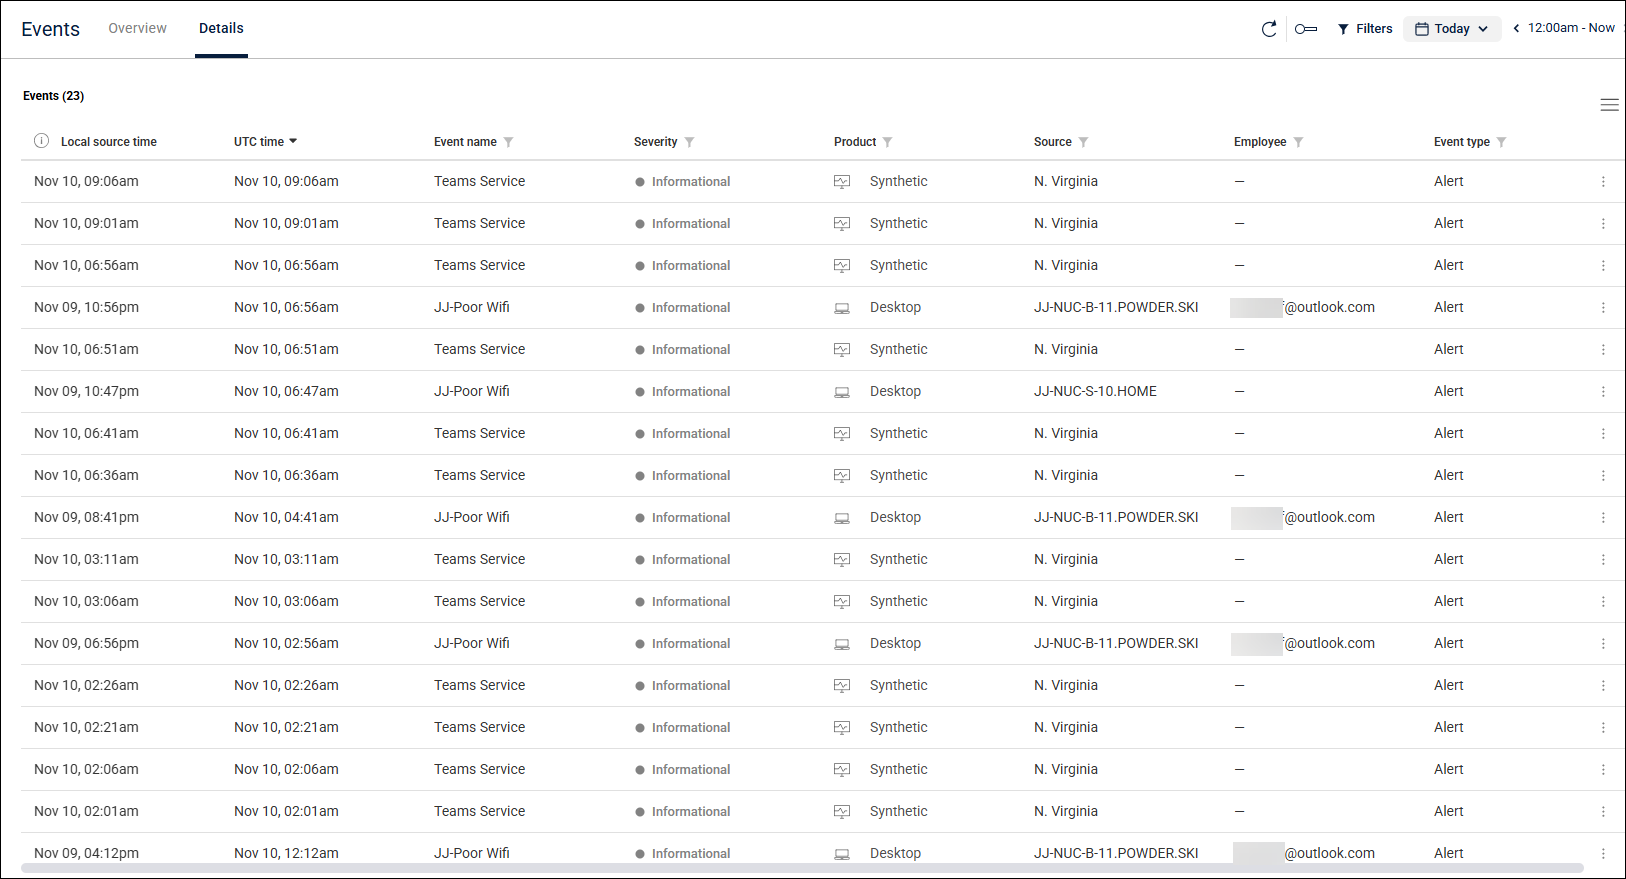
Details tab metrics
Metric | Description |
|---|---|
Local source time | Local time of the device that generated the alert (reporting the event) |
UTC time | The Coordinated Universal Time of the device reporting the event |
Event name | The name given to the event |
Severity | Level of severity of the event |
Product | The app in which the event occurred (Desktops, VDI or Synthetic Monitoring) |
Source | Name of the device on which the event occurred |
Employee | Name of the employee/employee device on which the event occurred |
Event type | Nature of the event (device status, net_http, session stress, etc.) |
You can display the events in ascending or descending order.
Edit event columns
To edit or reorder the columns of the Events table, click the column picker icon at the top right of the page.
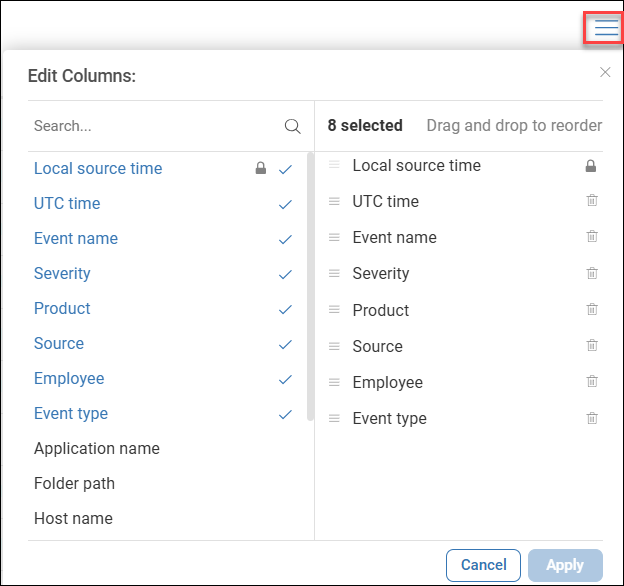
On this screen, you can:
Delete columns by clicking the delete icon
Reorder columns using drag and drop on the right side of the pane
Reset your column edits to the default view
Note: The Local time column is locked and can’t be edited, since it is mandatory.
Filter events
Click the filter sign next to each column to enter a condition. You can add multiple conditions.
Note: You can’t filter the UTC time and the Local source time columns.
Copy event URL or event details
Click the action menu (3 dots) to the right of an event to open a dropdown menu with the following options:
Copy event URL
Copy event details
Both options copy the required information to your clipboard and allow you to share this information with colleagues or partners for collaboration or investigation.
Event Details pane
To view details for a specific event, click anywhere on its row.
An Event Details pane opens, showing event metrics along with additional information, such as Alert ID, Folder path and Trigger condition.
.png)
The pane includes deep links. Clicking these links opens a new window of this metric in the corresponding ControlUp product, showing the configuration or device that are the source of the event.
For example:
Clicking the Event name metric opens the View Alert screen in Events Management, displaying the specific alert metric that triggered the event.
Clicking the Source metric opens the Details screen of the device that caused the alert in Devices, displaying detailed information.
Note:
In Synthetic Monitoring, deep links are available only for the Event name metric.
VDI events currently don’t include deep links.
For Devices events, you can also see the group and tags associated with the device that triggered the alert, at the time the alert was triggered.
Troubleshooting
If no events are displayed in the dashboard, it can be due to one of these scenarios:
No events occurred in the time period that you selected
There are no events to display due to one of the following reasons:
Alerts or Triggers haven’t been configured
Read Events Management Overview for details.No events have been generated yet.
Wait for events to be collected, or adjust Alert/Trigger settings.No Agents are deployed.
Ensure ControlUp agents are deployed for your Desktops and VDI to begin collecting data. For instructions, see the relevant Agent Deployment articles.
There is an error in the widget. Contact Support.
There is an error in the Events dashboard. Contact Support.