What is Events Management?
ControlUp Events Management is a central hub in ControlUp’s DEX platform that aggregates events from all integrated data sources in your environment into a single, chronological view.
It gives IT teams a unified, actionable timeline of all significant events affecting employees and devices, enabling fast remediation.
By providing one place to monitor events, trends and impacts, the dashboard helps identify issues, understand their effect on the users’ digital experience, pinpoint event timings, and proactively prioritize and address problems.
Key capabilities include:
Unified event view: Events from all monitored ControlUp products appear in one chronological list, so you don’t need to switch between different consoles.
Flexible filtering: Filter events by date, region, severity and product.
Proactive event analysis: Built-in correlation and trend detection helps the IT team identify patterns and prioritize issues.
Faster root cause analysis: Drill down from an event directly to the source alert/trigger configuration or the specific device where the event occurred, for quick investigation and resolution.
Scalability: The dashboard’s architecture supports future scalability through new product integrations.
Note: The DEX system automatically clears events 90 days after their creation.
Supported Data sources
Events Management displays events collected from the following ControlUp products:
ControlUp for Desktops (formerly Edge DX)
ControlUp for VDI (Real-Time VDI)
Synthetic Monitoring (formerly Scoutbees)
Prerequisites
Alerts or triggers must be configured in the source products before events can appear in Events Management.
Note: If alerts or triggers are missing or misconfigured, events are not displayed in the dashboard.
How to Configure Alerts and Triggers
Events Management displays alerts and triggers created in the source products.
Devices: Configure alerts within Events events page by goint to Events > Alert Rules > Add Alert. These alerts monitor endpoint and device health and performance.
For details, see Devices: Static Threshold Alerts or Devices: Anomaly Detection Alerts.Synthetic Monitoring: Configure Alerts inside each scout’s Alert Policy in Synthetic Monitoring. These monitor network and service availability.
For details, see Alert Policies.VDI: Set up triggers in the Real-Time DX Console, to monitor cloud services and session health.
The ControlUp Monitor responsible for collecting this data for VDI must be running version 9.1.5.313 or above.
Note that VDI triggers generate Incidents in the Real-Time Console, which appear in Events Management as Alerts.
Triggers are accessible only from the Incidents tab in the Console.
For details, see Setting up Triggers.
Terminology Note:
Different products use different names for notifications:
Desktops and Synthetic Monitoring use the term Alerts.
VDI uses the term Incidents.
These terms remain as they are in their respective apps.
However, Events Management uses the unified label ‘Alert’ for all these products.
Navigate the Events Dashboard
The Events dashboard consists of two tabs:
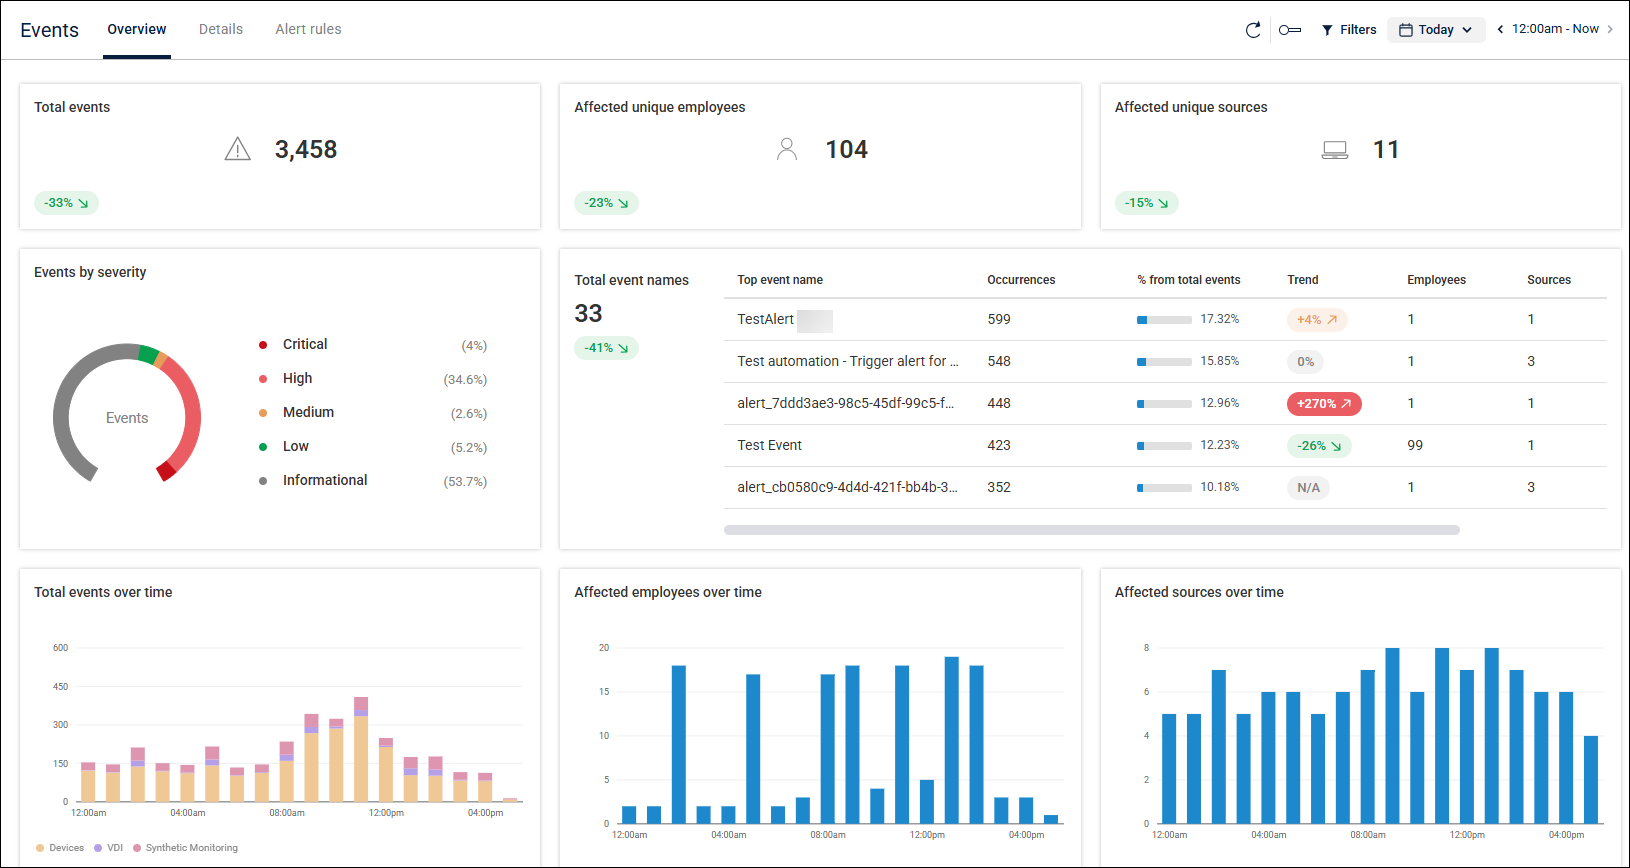
Overview: Displays widgets with high-level metrics and trends.
Details: Displays a list of all events with their specific attributes.
Widgets
The Overview tab includes the following widgets.
You can drill down into any widget (except for the top three summary widgets) to see detailed information.
Total events - Total number of events during the selected time period, with a trend indicator comparing it to the previous period.
Affected unique employees - Number of individual employees impacted. Each employee is counted only once, even if they experienced multiple events.
Also includes a trend indicator comparing it to the previous period.Affected unique sources - Number of individual devices impacted by an event. Each device is counted only once, even if the same event occurred on multiple devices.
Also includes a trend indicator comparing it to the previous period.Events by severity - Shows the distribution of severity levels and the percentage of total events per level. For details, see Event Severity Levels.
Total event names - The number of distinct event names recorded. This widget displays data on the five top events, their trends, occurrences and more.
Total events over time - A breakdown of events by product (Desktops, VDI, or Synthetic Monitoring). Each source has a different color, to enhance visibility.
Hovering reveals each product’s share and total count.Affected employees over time - Number of employees impacted during the selected time period.
Affected devices over time - Number of devices impacted during the selected time period.
Example use case:
Identify periods of high activity and view specific events during those peaks. To do so, go to the Total events over time widget, and then switch to the Details tab to investigate the specific events
Event Severity Levels
Events are categorized by severity. There are five severity levels, marked by different colors:
Informational (gray) - Notifications, minor functional messages, log entries
Low (green) - Cosmetic or minor functional issues
Medium (orange) - Non-critical function problems or performance issues
High (red) - Partial system failures, performance degradation, important functionality impairment
Critical (dark red)- System-wide issues: data corruption, outages, security breaches, immediate risk
Note
You can’t configure severity levels for Synthetic Monitoring and VDI. Therefore, events from these products always appear as ‘Informational’ level.
Filter Events
Use the Filters option to filter events by:
Severity
Product (Desktops, VDI or Synthetic Monitoring)
Event name
Add filter conditions
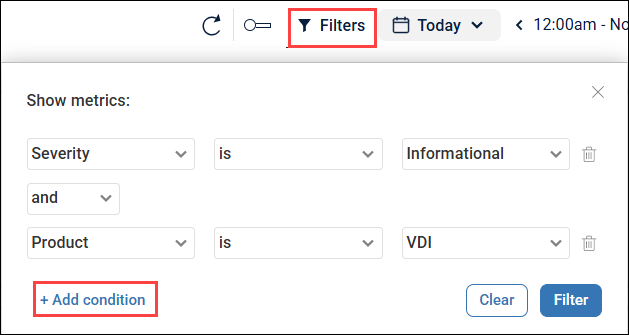
To fine-tune your filters:
Open Filters.
Add one or more conditions (Severity, Product, etc.),
Select the value.
You can add multiple conditions to a filter, to narrow the results.
For example:
To view all VDI events with Informational severity level, add a Severity condition of ‘Informational’ and a Source condition of ‘VDI’.
View Event Details
To view full event details, go to the Details tab and select an event.
For detailed information about event fields, see Event Details.