Use the following use case examples to learn how to monitor data in your organization with the ControlUp Disk Monitor.
To install Disk Monitor, see here.
Use cases
Disk Monitor provides clear visibility into disk activity. Here's a few common ways you can use it:
Identify hard drive space loads
When a machine is running out of free space, Disk Monitor can be triggered automatically. Within seconds, you’ll have a report showing which recent files are consuming large amounts of space - perfect for helpdesk teams to respond quickly.
Diagnose Citrix write cache performance
Citrix environments (PVS or MCS) use write caches that can fill up and degrade performance. Disk Monitor helps identify unnecessary write activity to optimize cache usage and avoid RAM exhaustion. Daily CSV reports show what is being written, and by which processes.
Data analysis for VDI
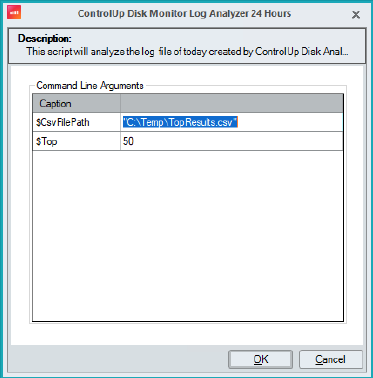
ControlUp provides Script-Based Actions (SBAs) to analyze disk write data and generate reports of the top files written.
The following versions are available:
- 24-hour analysis, for daily insights.
- 7-day analysis, for troubleshooting or automatic triggers.
Results are exported to a CSV file.
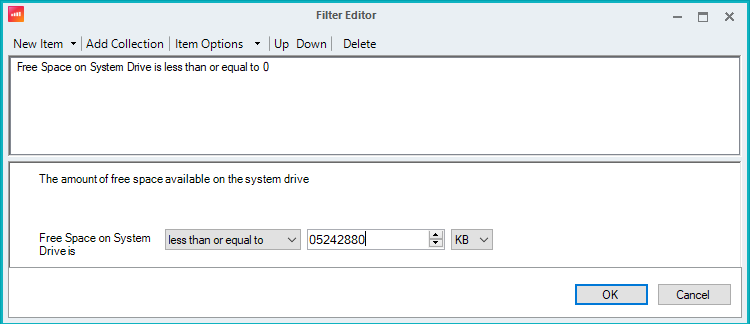
Set up VDI Triggers
With ControlUp for VDI, we can create a Free Space on System Drive trigger. For example, if it’s less than or equal to 5GB:
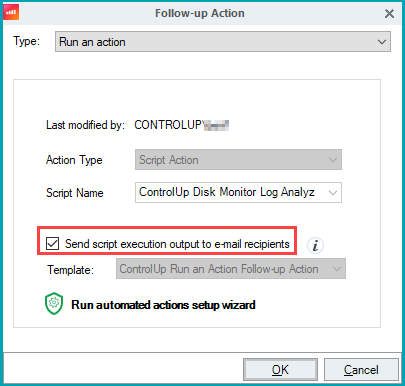
We can then set up the 7 days log analyzer script as an action, and send the output per email as a follow-up action.
Use Disk Monitor in non-persistent environments
When using the Disk Monitor in a non-persistent environment, we recommend ensuring that the data analysis SBA saves the CSV output to persistent storage.
If you also want to save the logs created by the tool to persistent storage, perform the following the steps:
- To modify the log location defined in the log4net configuration file, navigate to: C:\ProgramData\ControlUp\DiskMonitor\log4net.config
- Edit line 25 to change the output location of the summary log to a persistent directory.
- After you edit the log location, restart the service.
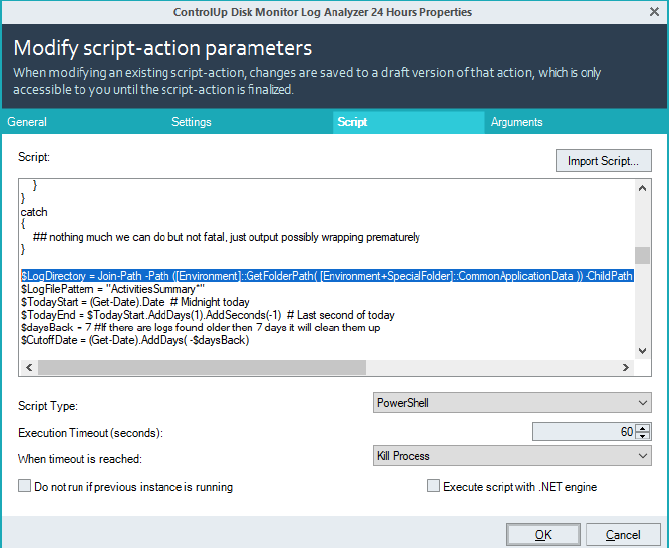
- To update the SBA to reflect the new log location, change the
$LogDirectoryparameter in both the 24-hour and 7-day scripts to point to the new output folder.
These adjustments ensure that log data remains available even in a non-persistent environment.
Data analysis for Desktops
A separate script is available in the ControlUp Script Library to analyze log data and produce JSON output for indexing.
The following versions are available:
- 24-hour script, writes to the index disk_monitor_24hours.
- 7-day script, writes to the index disk_monitor_7days (overwrite enabled).
Set up Desktops triggers
We recommend leaving the default when adding scripts from the ControlUp Script Library. These are:
- ONCE PER DAY trigger to the 24 hours script.
- CUSTOM ACTION – System trigger to the 7 Days script.
-
To set up an automatic run with an alert, the best practice is to duplicate the 7-day script and rename it from "7-days" to "Alert-Trigger".
-
Change the data collection to the index disk_monitor_alert and leave the Overwrite Existing Data checkbox selected.
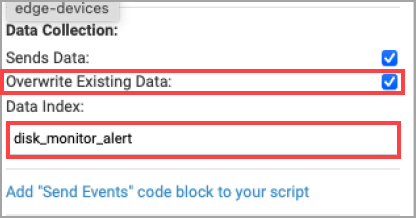
-
In Configuration > Alerts, click Add Alert.
-
Configure the following alert to run the script if the disk has equal or less than 5GB of free space, as shown in the example below:
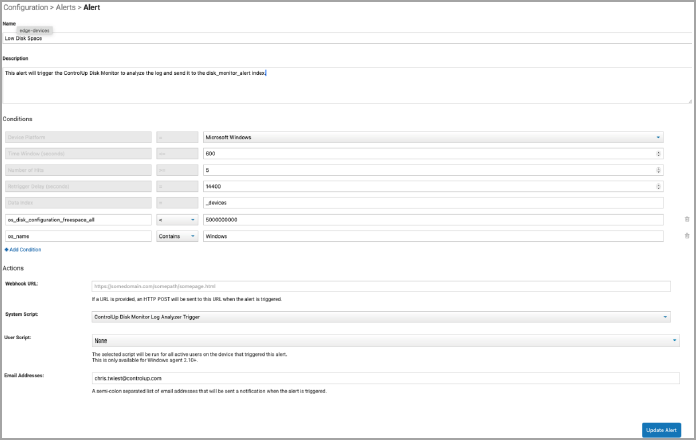
Name: Low Disk Space
Description: This alert will trigger the ControlUp Disk Monitor to analyze the log and send it to the disk_monitor_alert index.
Conditions:- Microsoft Windows
- 600
- 5
- 14400
- _devices
-
Click +Add Condition, select os_disk_configuration_freespace_all, select <, and enter 5000000000.
-
Click +Add Condition, select os_name, select CONTAINS, and enter Windows.
-
In the System Script field, select
ControlUp Disk Monitor Log Analyzer Alert-Trigger. -
In the Email Addresses field, enter your email address.