The Big Screen Dashboard developed by the ControlUp Innovation Guild uses Grafana to visualize the data. This guide helps you set up your own Grafana instance and import the Dashboard.
What is Grafana?
Grafana is an open-source analytics and visualization platform used to monitor metrics from a wide range of data sources. It lets you create interactive dashboards to track system performance, application health, user activity, and more. With data coming from ControlUp, it can used in DevOps, IT operations, and business intelligence to gain real-time insights and make data-driven decisions.
Step 1: Install Grafana
Choose from the following options to setup Grafana:
Option A: Grafana Cloud (SaaS)
Grafana offers a SAAS version of their Dashboard software. Keep the privacy and data considerations in mind when choosing the SAAS version.
Sign up at https://grafana.com for a free or paid plan.
Create a workspace and access Grafana instantly in the cloud
The free plan supports up to 10k series and 3 users which is enough to get you started with the Big Screen Dashboard.
Option B: Local Installation on Linux
Grafana can also be installed onto a Linux VM.
Run the following commands on Debian/Ubuntu:
sudo apt-get install -y software-properties-common |
After running the commands, you can access Grafana at: http://localhost:3000
Option C: Run in Docker (for example Azure)
Grafana can also be setup in a Docker container in this example we are using an Azure Container Instance.
Azure CLI one-liner:
az container create \ |
After installing, access via: http://my-grafana-instance.region.azurecontainer.io:3000
Step 2: Install the Infinity Plugin
By default, Grafana doesn’t have a data source which you can link to an API. This is why you need the Infintiy plug-in. If you are using the SAAS version of Grafana, you probably have the plugin already installed by default. If not, choose from the following options to install the infinity plugin:
Option 1: Via UI Plugin Catalog
In Grafana go to Administration > Plugins.
In the Search box, enter Infinity.
Click Install.
.png)
Option 2: Via CLI
When using your own Grafana open source instance, you can install Infinity using the command line as follows:
grafana-cli plugins install yesoreyeram-infinity-datasource |
Step 3: Create the Required Data Sources
Once you have the Infinity plugin, you must create two Infinity data sources.
In Grafana, click Data Sources.
.png)
Click + Add new data source button.
.png)
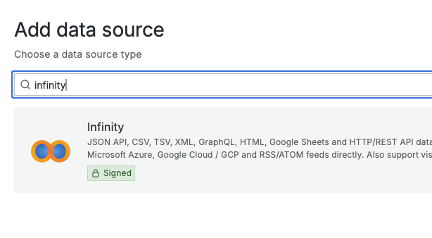
In the Add data source popup, under Choose a data source type, enter Infinity.
Set up the 2 ControlUp data sources by entering the information in the data source Settings page as follows:
ControlUp DEX data source:
Name: yesoreyeram-infinity-<YOUR-ENV-NAME>-DEXAuth type: Bearer Token
Auth details: Add your ControlUp API key as the bearer token
Allowed hosts: https://api.controlup.com (this URL must be whitelisted and added under Allowed hosts).png)
Synthetic Monitoring (Scoutbees) data source:
Name: yesoreyeram-infinity-<YOUR-ENV-NAME>-SCOUTBEESAuth type: API Key Value Pair
- Key: x-scoutbees-key
- Value: Your Synthetic Monitoring (Scoutbees) API key
- Add to: Header
Allowed hosts: https://api.scoutbees.io (this URL must be whitelisted and added under Allowed hosts).png)
Step 4: Download and Import the Dashboard JSON
Download the latest version of the Big Screen Dashboard (JSON file) from the ControlUp Download Center > Innovation Guild Solutions.
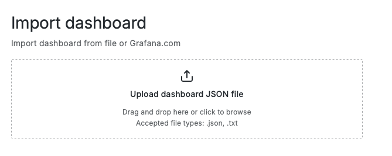
Once you’ve downloaded the JSON file, you can import it into Grafana.
Import the Dashboard JSON into Grafana
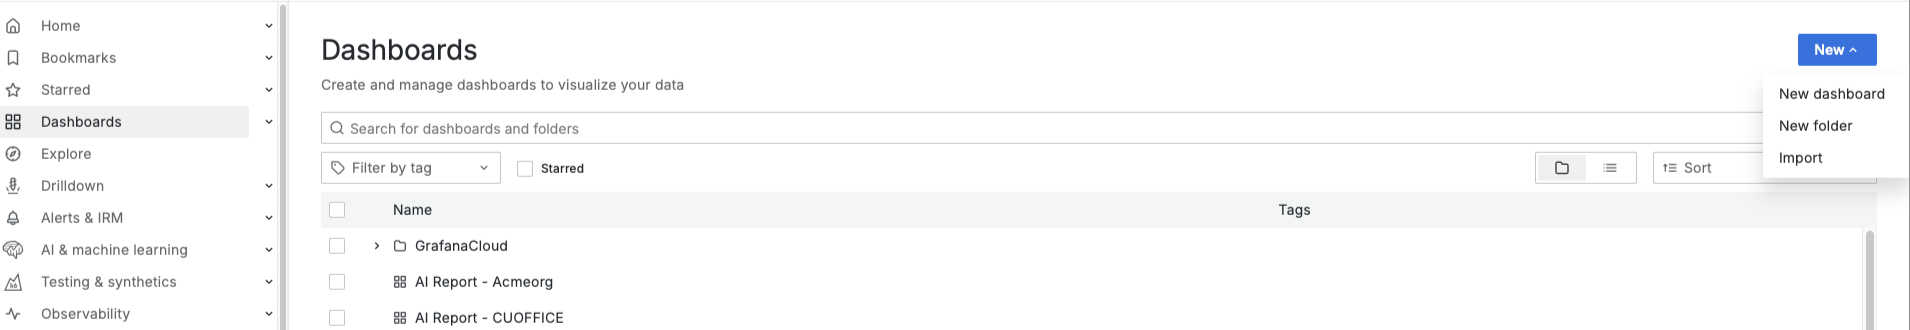
In the Grafana menu, go to Dashboards > New > Import.
Upload the dashboard JSON file you downloaded from the ControlUp Download Center > Innovation Guild Solutions.
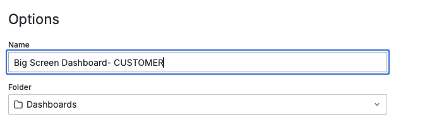
The download JSON is named “Acme Org”. You must replace that and enter your own name in the Options > Name field.
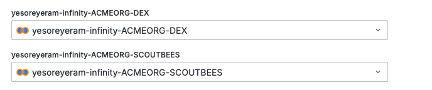
Select the DEX and Synthetic Monitoring (Scoutbees) Infinity data sources you set up in the previous procedure Create the Required Data Sources. In the example displayed in this image, we used ACMEORG as the name of the organization. In your setup, use the names as you defined above.
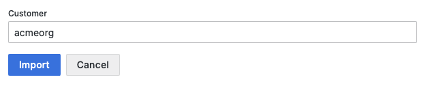
For Customer, find the organization name you see in the URL when you go into app.controlup.com. In the example displayed in this image, it is acmeorg. In your setup, use the name your URL includes.

Enter the name from your URL in the Customer field and click Import. This variable is used to link back to your environment when clicking on widgets in the Big Screen Dashboard.
The Big Screen Dashboard should now load.

Step 5: Set up ControlUp Synthetic Monitoring Widgets (Optional)
The dashboard is designed to automatically load all available widget data based on your ControlUp license level. However, the Synthetic Monitoring widgets require manual configuration before they can display any data.
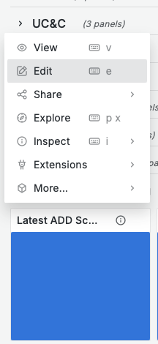
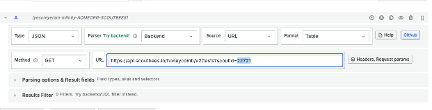
In Grafana, click Edit on the latest ADD test (scout) widget. This widget came with the Dashboard JSON you imported above.
Find the test (scout) number at the end of the URL for the widget. In the example, the number is 22721.
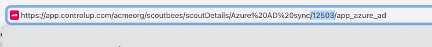
In the ControlUp platform at app.controlup.com, go to Synthetic Monitoring and find the test (scout) you want to monitor and click to see its details.
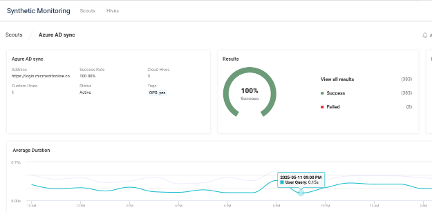
Look at the URL of the page you opened and find the test (scout) number.
Copy this number into the widget URL in Grafana as you accessed in step 2 in this procedure. Click refresh. The latest test (scout) data is now displayed in the widget. You can change the Title and Description of the widget to reflect your test’s (scout’s) name.
Big Screen Dashboard Customizations
You can drag and drop any panel and change the size of it by clicking Edit in the top corner.
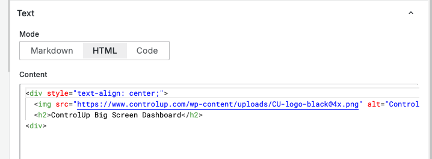
You can customize the info widget at the top to display your logo by clicking on the 3 dots and selecting Edit.
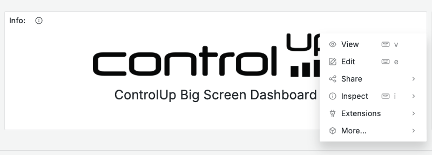
In the popup that opens, select Mode: HTML and edit the <img src> to point to the URL where you have your logo stored.