Note
8 days after your organization migrated to the new data pipeline, data will be displayed in the Sizing Recommendations report.
The Sizing Recommendations report shows historical information that enables you to optimize resource allocations for monitored machines. It presents analyses of CPU and RAM usage over the previous month based on the data collected by ControlUp Agents running on the monitored machines.
The report offers recommendations to optimize the CPU, RAM, and disk allocations of each machine. These recommendations are derived using AI and machine learning from the usage data during the selected time period. We use an algorithm that adds a 15% buffer to the 95th percentile of usage values recorded over that time period.
Use this report to answer questions such as:
What is the best allocation of the available CPU cores and RAM for your organization’s machines?
Does machine X have sufficient resources available to run its workload?
Can CPU cores currently allocated to machine X be reallocated to other machines?
Can any machines in the system perform their required functions with a single CPU core?
Which Azure Virtual Machine sizing option best fits your organization's requirements?
Report Data
The report includes the following sections:
Parameters
Folders
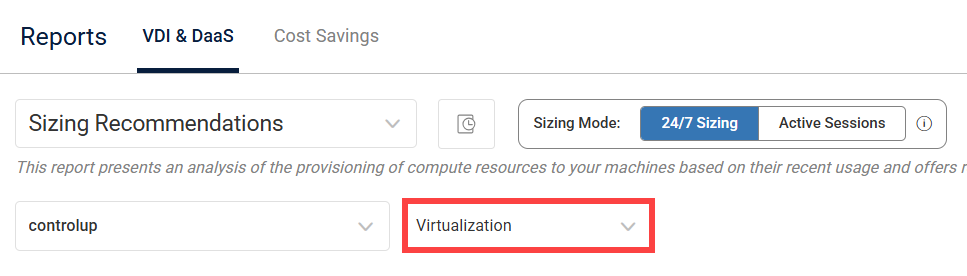
Select the environment scope of the report with the folder dropdown list. By default, data for your entire organization is selected. You can select to view the machine data according to Virtualization or Azure Cost Analysis mode. By default, Virtualization mode is selected.
New Data Pipeline
Virtualization and Azure cost analysis modes are only available for data pipeline reports. For more details, see here.
Sizing Mode

If you are viewing Virtualization mode, you can refine your report data by selecting a specific Sizing Mode using the toggle at the top of the report page.
The report offers distinct sizing modes:
24/7 Sizing (Default): Provides an analysis of compute resource provisioning based on all historical data.
Active Sessions: Optionally, switch to this mode to base sizing calculations only on time periods when a user session was active on a monitored machine.
By selecting Active Sessions, you can exclude irrelevant "idle" data and capture a more accurate reflection of actual resource demand during peak work hours. This tailored view provides even more precise sizing recommendations to optimize your environment's performance and cost-efficiency.
Machines Count
The report shows the number of managed machines from the total number of virtual machines in the selected folder. The Managed Machines widget shows the total number of machines that were monitored by the ControlUp Agent over the past 30 days. The Total VMs Count widget shows the highest daily count of VMs that ran on the host machines over the past 30 days.
Aggregate data shown in the widgets below is only from the managed machines with the ControlUp Agent installed and running.
Virtualization Aggregate Data
Aggregate data calculations are based on the CPU and RAM usage data retrieved by the ControlUp Agents running on each machine. The agents retrieve data every three seconds, which they use to calculate average usage for each five minute interval. They retain the average usage values for a month after they are generated, which they use to calculate resource usage in the report.
CPU Values
Because a single CPU core can't be divided into parts, all non-integer CPU values are rounded up to the next largest integer.
The aggregate data for CPU and RAM usage is shown in the following widgets:
Machines by CPU Sizing
Shows the distribution of the machines in the selected folder by their CPU sizing status:
Over: Machines allocated more CPU resources are than needed.
Right: Machines allocated optimal CPU resources.
Under: Machines allocated less CPU resources than needed.
The center of the donut chart shows the total number of machines. The proportion of machines with each status is represented graphically in the outer circle of the chart, and by percentage above the chart.
Hover over a bar on the circle to show the total amount of machines for each CPU size recommendation. Click a bar to navigate to a specific machine(s) included in the CPU recommendation in the Data per Machine grid at the bottom of the report.
Machines by Memory Sizing
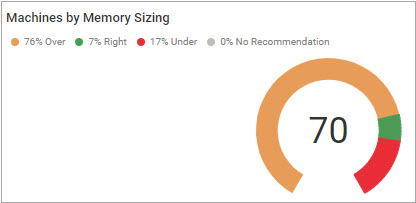
Shows the distribution of the machines in the selected folder by memory sizing status:
Over: Machines allocated more memory resources are than needed.
Right: Machines allocated optimal memory resources.
Under: Machines allocated less memory resources than needed.
The center of the donut chart shows the number of machines. The proportion of machines with each status is represented graphically in the outer circle of the chart, and by percentage above the chart.
Hover over a bar on the circle to show the total amount of machines for each memory size recommendation. Click a bar to drill down to a specific machine(s) included in the memory recommendation in the Data per Machine grid at the bottom of the report.
Top Sizing Groups Recommendation Ranges
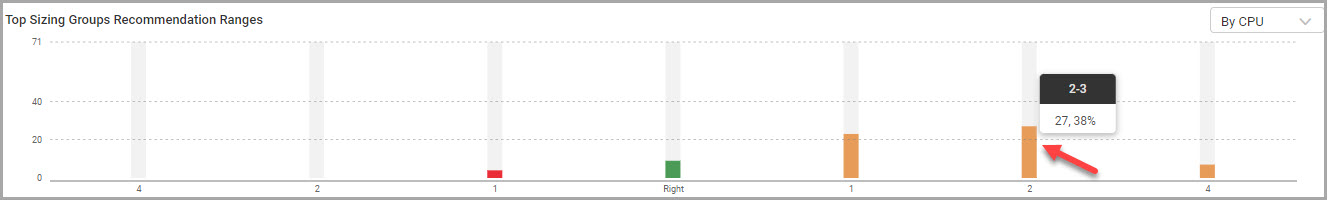
Shows the distribution of recommended sizing ranges for your machines, according to the metric you select. By default, CPU is shown. Hover over a bar to show the number and percentage of machines by recommended sizing ranges:
Orange: Machines allocated more resources than needed.
Green: Machines allocated optimal resources.
Red: Machines allocated less resources than needed.
Click a bar to drill down to specific machines included in the sizing groups recommendation in the Data per Machine grid at the bottom of the report.
Sizing Groups by CPU Ranges
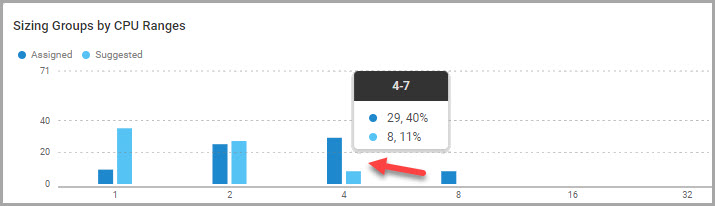
Compares the total amount and percentage of CPU ranges currently assigned to the managed machines to the optimal amount and percentage of CPU ranges suggested to assign to the machines. Hover over a bar to show the number and percentage of managed machines by CPU ranges.
Sizing Groups by Memory Ranges
Compares the total amount and percentage of memory ranges currently assigned to the managed machines to the optimal amount and percentage of memory ranges suggested to assign to the machines. Hover over a bar to show the number and percentage of managed machines by memory ranges.
Machines by CPU Utilization
Compares the average number of CPUs used per machine to the average number of CPUs assigned to machines. Hover over a bar to show the total amount of CPUs utilized or unutilized.
Machines Memory Utilization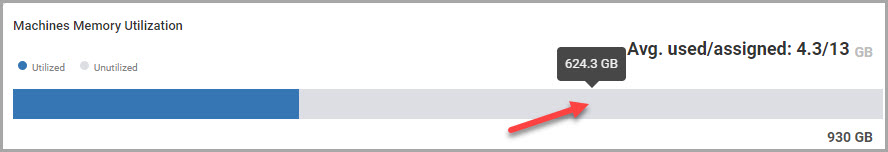
Compares the average amount of memory used per machine to the average amount of memory assigned to machines. Hover over a bar to show the total amount of memory (GB) utilized or unutilized.
Resource Recommendations
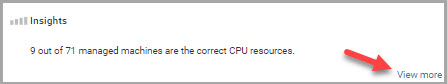
Scroll through the Insights box to view recommendations for specific resources of the managed machines in the selected folder. Click View more to navigate to a machine on Data per Machine grid included in each resource recommendation.
Azure Cost Analysis
New Data Pipeline
Azure Cost Analysis mode is new for data pipeline reports.
If you select Azure Cost Analysis mode, the report creation wizard opens to generate a report to understand how to reduce your Azure compute costs.
Generate Report
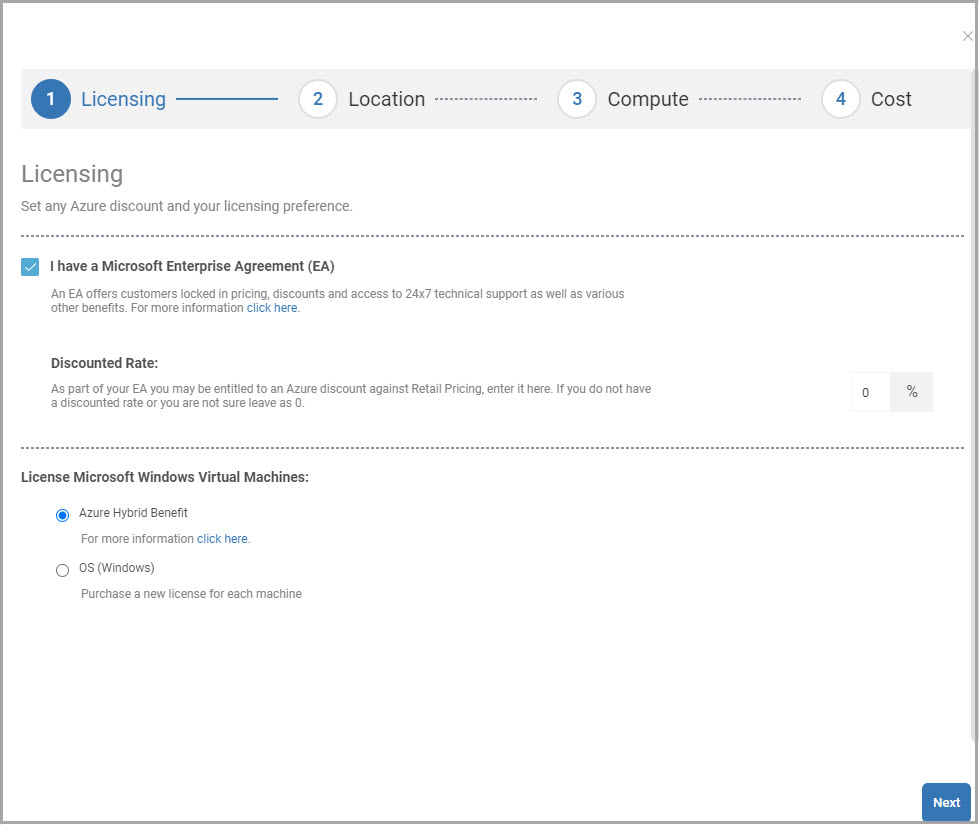
You must complete the following steps to generate a new report:
Licensing. Set an Azure discount, if you already have one, and your licensing preference for Microsoft Windows Virtual Machines (Azure Hybrid Benefit or OS).
Location. Select the Azure Geography Group and Azure Region(s) where you wish to see representative costs.
Compute. Select all the features each Azure Virtual Machine selection should support and all the storage options each disk selection should support.
Cost. Select your preferred currency to use for all cost information in the report and which advanced cost option to help reduce your Azure costs.
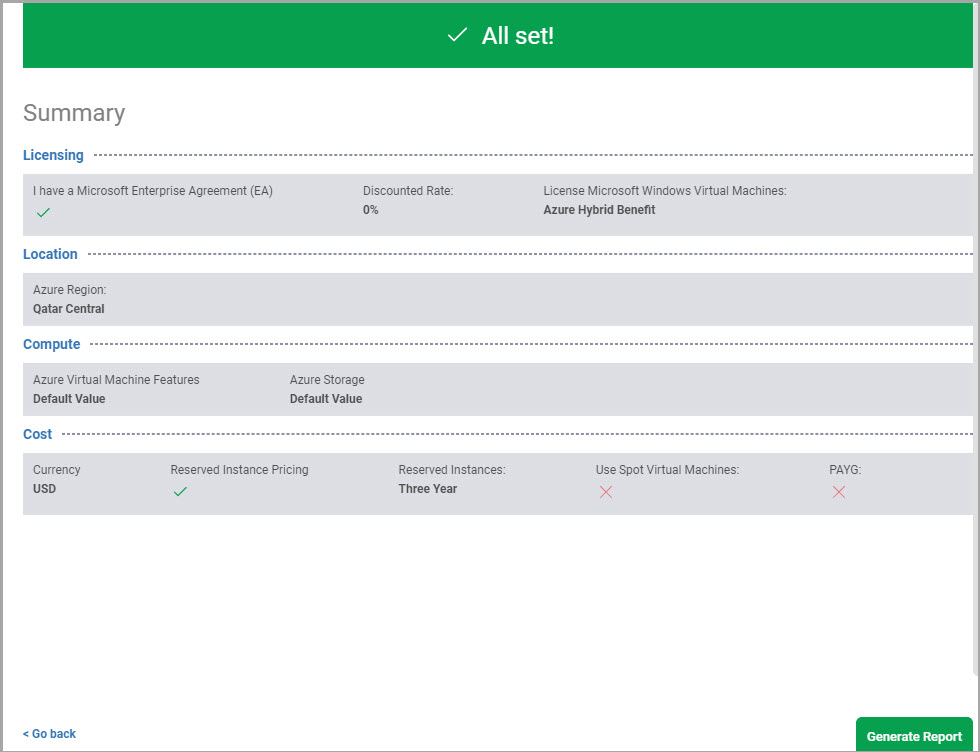
After you complete the steps, verify your selections in the report summary and go back to change any settings as needed. Click Generate Report to display your report.
Report Settings
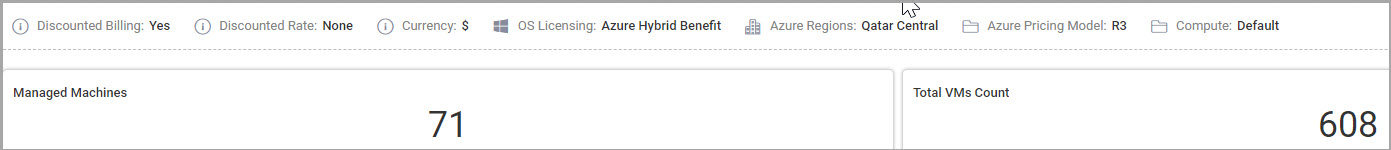
In Azure mode, the report displays the following Azure cost analysis settings above the machines count:
Discounted Billing. Indicates if you have a Microsoft Enterprise Agreement (EA).
Discounted Rate (%). Your Azure discount rate against retail pricing.
Currency. Your preferred currency for the report.
OS Licensing. Your Azure Hybrid Benefit or OS (Windows) Virtual Machines License.
Azure Regions. Your selected Azure Location.
Azure Pricing Model. Your selected pricing models to help optimize your Azure costs. We recommend you choose PAYG for production environments and Spot for QA environments.
Compute. Your selected Azure VM and disk features.
Azure Aggregate Data
The aggregate data for Azure cost analysis is shown in the following widgets:
Machines by AZ VM Sizing
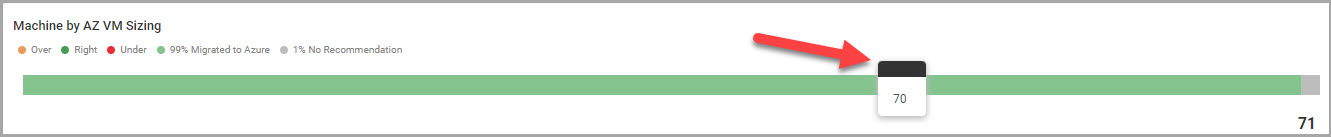
Shows the distribution of the managed machines in the selected folder by their Azure VM sizing status:
Over: Machines allocated more resources are than needed.
Right: Machines allocated optimal resources.
Under: Machines allocated less resources than needed.
% Migrated to Azure. Percentage of machines that migrated to Azure.
Hover over the legend on the top of the chart to show the number of machines for each status. You can click a data series name on the legend to highlight the series on the chart. Hover over a color on the bar to show the number of machines for each sizing status.
Cost Saving
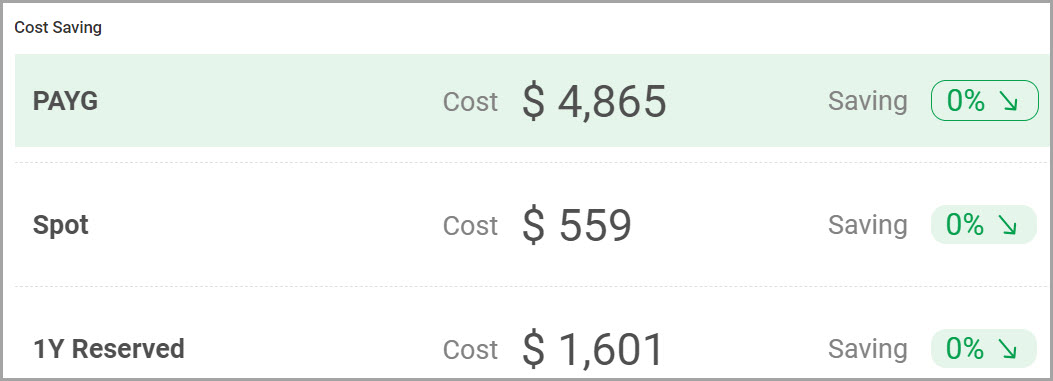
Compares the total cost and percentage of savings of your selected Azure pricing model to the other options. Your selected pricing model is highlighted on the list. You can change the amounts shown in the Cost column according to the cost option that you select when you generate the report.
Saving
The amounts shown in the Saving column includes the percentage of savings only for Azure machines, rather than all the managed machines in your organization.
Azure VM Type Groups by VM Family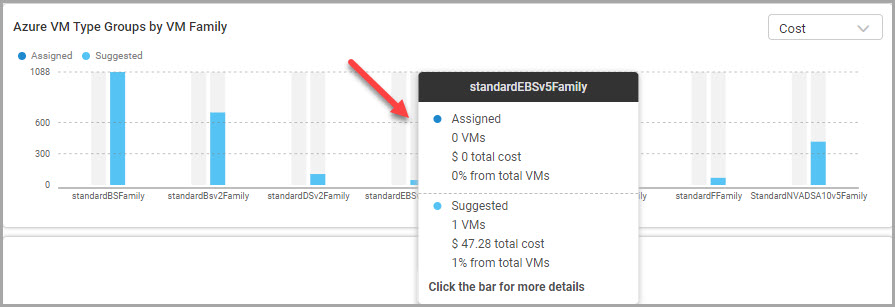
Compares the total amount of Azure VMs currently assigned to Azure VM families (sizing groups) to the optimal amount of Azure VMs suggested to assign to VM families. Select to view the chart according to usage or cost. By default, usage is selected. Hover over a bar to show the number, percentage, and total cost of managed machines by VM family. Click a bar to view the distribution of VM type groups in the selected VM family by number (usage) or cost.
Azure Disk Type Groups by Disk Tier
Compares the total amount of Azure VMs currently assigned to Azure virtual disk tiers to the optimal amount of Azure VMs suggested to assign to disk tiers. Select to view the chart according to usage or cost. By default, usage is selected. Hover over a bar to show the number, percentage, and total cost of managed machines by disk tier. Click a bar to view the distribution of disk type groups in the selected disk tier by number (usage) or cost.
Top Machine by Cost
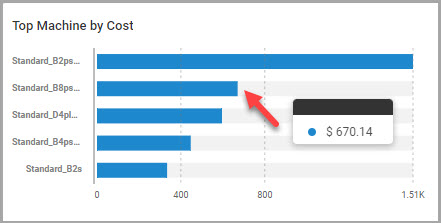
Compares the top managed machines suggested resource cost by Azure VM SKU grouping. Hover over a bar to show the cost of each SKU grouping.
Top Managed Disk by Cost
Compares the top OS managed disk suggested resource cost by Azure disk SKU grouping. Hover over a bar to show the cost of each SKU grouping.
Top Machine by Size
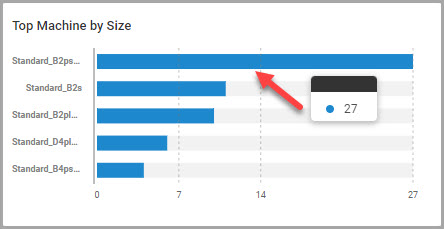
Compares the top managed machines suggested resource count by Azure VM SKU grouping. Hover over a bar to show the cost of each SKU grouping.
Top Managed Disk by Size
Compares the top OS managed disk suggested resource count by Azure disk SKU grouping. Hover over a bar to show the cost of each SKU grouping.
Data per Machine
The data grid at the bottom of the report displays details for each individual managed machine, including recommended resource allocation changes (in Azure mode, Azure SKU resources). Click a machine name to drill down to the Machine Usage Trends report to view more resource usage trend details of the machine, such as average CPU usage, memory usage, and disk free space trends.
You can view the data according to the columns preset you select. By default, the table is sorted by the CPU Recommendation column.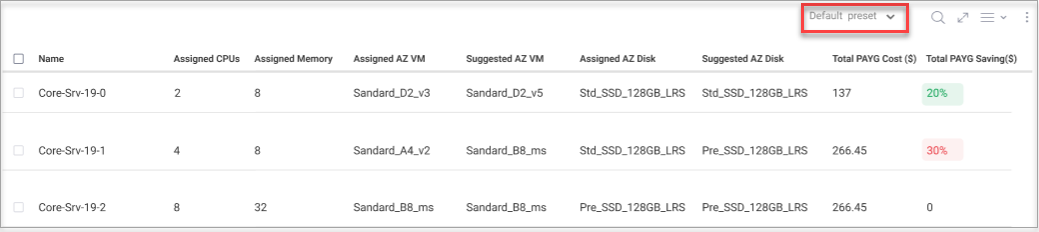
Presets 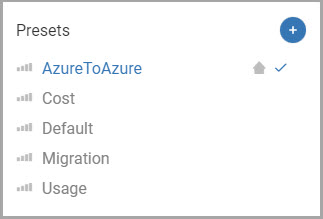
In Azure mode, depending on what kind of information you want to view, you can select from the out-of-the-box presets already created for the report:
AzureToAzure. Shows assigned and suggested Azure VM and disk size, total cost, and total saving.
Cost. Shows assigned and suggested Azure VM and disk size, detailed cost and saving calculations.
Default. Shows assigned and suggested CPUs, assigned memory, assigned and suggested Azure VM and disk size, total cost, and total saving.
Migration. Shows assigned and suggested CPUs, assigned memory, suggested Azure VM and disk size, total cost, and total saving.
Usage. Shows assigned and suggested CPUs and memory, and assigned and suggested Azure VM and disk size.
You can also create your own custom presets to include additional columns to display, with the filters you apply when you work in your custom preset. When you view a report with a custom preset selected, any changes you make are saved to the preset.
For more information about presets, see Column Presets.
Export Report
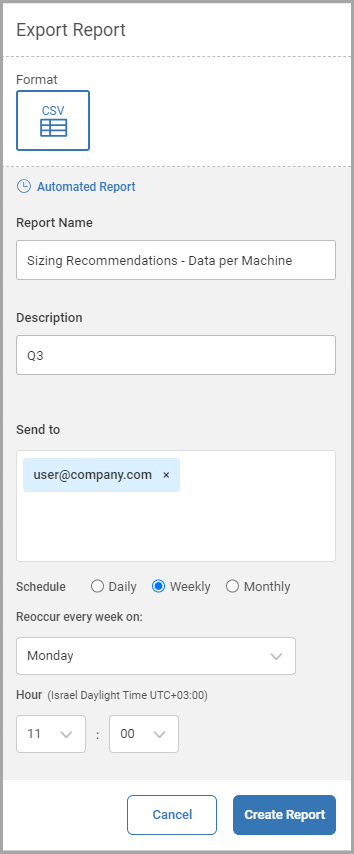
You can export the Data per Machine grid. To download the report as a CSV file, click the Export report icon on the top right of the grid.
You can also choose to export the grid as an automated report to email recipients that you add. To set the report as automated, in the Export Report dialog box, click Set as Automated Report. Add email recipient(s) to the Send to list as needed, and set the Schedule and Hour to send the automated report.
Calculations
The metrics and calculations in the grid are based on the usage data retrieved by the ControlUp Agents running on each of the monitored machines. Sizing recommendations are calculated using the following algorithm:
From the usage data collected by the agent, minus the 5% most extreme values. Only the 95% of the values that are closest to the median value are used.
Multiply the value by 1.15 to add a 15% buffer to the highest value retained (i.e., the 95% value).
Multiply the value by the number of CPU cores, or the amount of RAM, currently allocated to the machines. The result is the recommended value.
Note
For CPU calculations, the result is rounded up to the next integer because a single CPU core can't be divided into parts.
Grid Columns
The Data per Machine grid includes the following columns:
Column | Description |
|---|---|
Machine Name | Name of the machine. |
Assigned CPUs | Amount of CPUs currently installed in the machine. |
Suggested CPUs | Amount of CPUs suggested to assign to the machine, based on recent CPU usage. |
CPUs Recommendation | Amount of CPUs recommended to add or remove, based on machine configuration and recent CPU usage. |
Assigned Memory | Amount of memory currently installed in the machine. |
Suggested Memory | Amount of memory suggested to assign to the machine, based on recent memory usage. |
Memory Recommendation | Amount of memory recommended to add or remove, based on machine configuration and recent memory usage. |
The Data per Machine grid includes the following additional columns for Azure mode only:
Column | Description |
|---|---|
Assigned AZ VM Size | Azure VM size currently assigned to the machine. |
Suggested AZ VM Size | Azure VM size suggested to assign to the machine. |
Assigned AZ OS Disk Size | Azure OS disk size currently assigned to the machine. |
Suggested AZ OS Disk Size | Azure OS disk size suggested to assign to the machine. |
Total Cost | Total cost of Azure VM + OS disk. |
Total Savings (%) | Total percentage of savings. |
Total PAYG Cost | Total PAYG SKU cost of Azure VM + OS disk. |
Total PAYG Savings (%) | Total percentage of PAYG savings. |
Total Spot Cost | Total Spot SKU cost of Azure VM + OS disk. |
Total Spot Savings (%) | Total percentage of Spot savings. |
Total R 1Y Cost | Total 1 year reserved cost of Azure VM + OS disk. |
Total R 1Y Savings (%) | Total percentage of 1 year reserved savings. |
Total R 3Y Cost | Total 3 year reserved cost of Azure VM + OS disk. |
Total R 3Y Savings (%) | Total percentage of 3 year reserved savings. |