As a comprehensive real-time monitoring solution for your environment, the ControlUp Real-Time DX Console displays a flexible measure of system health, called Stress Level, for every monitored resource such as a folders, machines, user sessions, apps, or processes.
The Stress Level column is displayed in the console with the following ranges:
- None
- Low
- Medium
- High
- Critical
You use the Stress tab to configure these alerts settings.
Use the Stress Level column to quickly determine the health of your resources, for example by sorting the grid so that highly stressed resources are on top. Below we explain how to configure the Stress Level column to most optimally represent the current health status of resources in your environment.
Use Case
To learn how to configure stress settings to reduce IT ticket submissions, use our interactive use cases guide:

Stress Settings Tab Layout
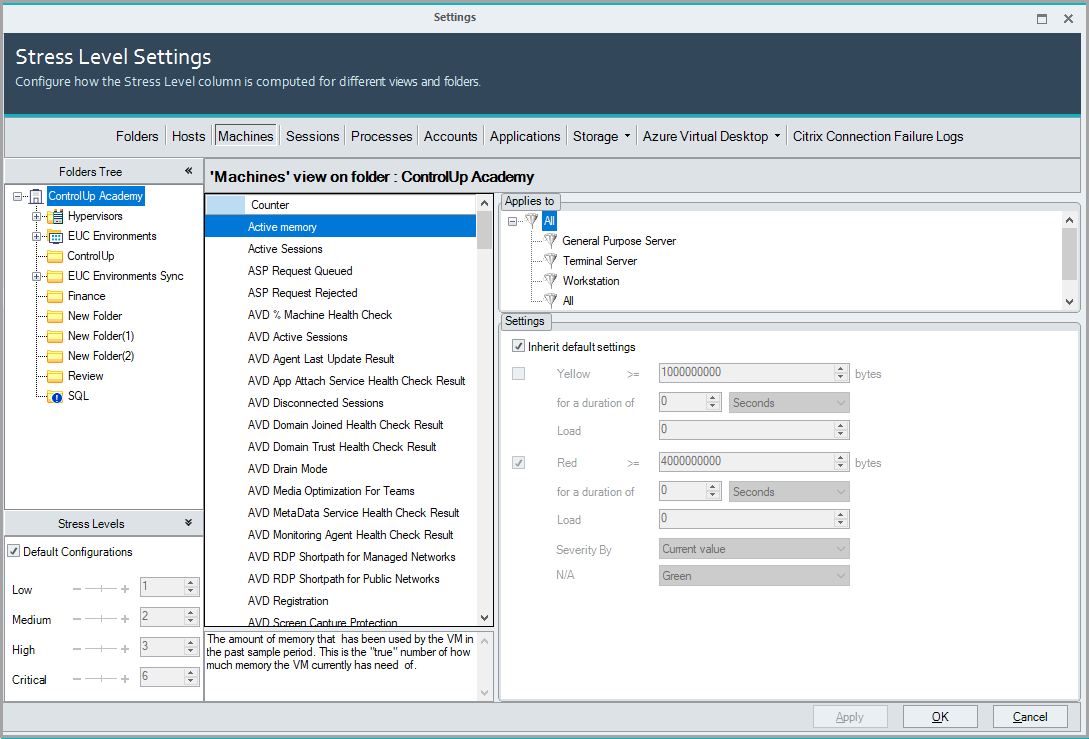
Use the Stress Level Settings tab in the Settings window to configure all Stress Level-related settings. As shown in the image above, this tab includes:
- Folders Tree identical to the tree displayed in the My Organization pane.
- Navigation bar to switch between resource types.
- Counter selection area.
- Applies To area to configure filters
- Settings area to configure the computation of the Stress Level value.
- Stress Levels area to configure the thresholds between different levels.
Stress Level Inheritance
Default Settings
By default, every ControlUp organization contains a single set of Stress Level settings, configured on the root folder of the organization. Unless configured otherwise, these settings are inherited by all child folders and the machines within them.
Subfolder Inheritance
ControlUp’s folder tree is designed to allow the user to arrange machines in folders according to their type. For example, you might want to separate your workstations from your servers, and further segment the servers folder into subfolders containing different types of machines. This type of arrangement is generally convenient, and is especially useful for configuring different Stress Level settings for different types of machines.
Filter Inheritance
Besides segmenting resources into subfolders, ControlUp also distinguishes between resources automatically, allowing to configure performance counter thresholds which are optimal for each monitored resource. This is done by using filters, which are pre-configured criteria configurable in the counter area.
Machine Filters
You can configure different thresholds for each machine type using the filter area of each counter configuration. ControlUp distinguishes between the following machine types:
- General Purpose Server. A machine running a server-class Operating System, with no Terminal (Remote Desktop) Services installed. This could be a file server, an Exchange server, a Web server or an SQL server. These machines typically host a limited number of user sessions for administrative purposes, and have most of their resources consumed by background services.
- RDS. A machine running a server-class Operating System with Terminal (Remote Desktop) Services role installed. These machines typically host multiple end-user sessions, running virtualized applications or full-desktop environments.
- Workstation. A machine running a client Operating System, such as Windows 7, 8 or XP. This type of machine typically hosts a single user session with foreground processes (applications) consuming most of the machine’s resources.
- All. All machine types.
By default, all filters within every counter inherit its default thresholds. By clicking on the filter name on the left, you can customize the thresholds for each filter, as described below.
Configuring the Stress Level Computation
The counter area of the Stress Settings tab allows you to configure which metrics contribute to the computation of the Stress Level column for each resource in ControlUp.
Per-Counter Configurations
The counter area includes a row for every column included in each of console views. Please note that each view supports a different set of columns. You can switch between views using the navigation buttons on top of the grid.
Each counter row includes several settings which configure the contribution of that counter to the total Stress Level of the record.
Yellow and Red
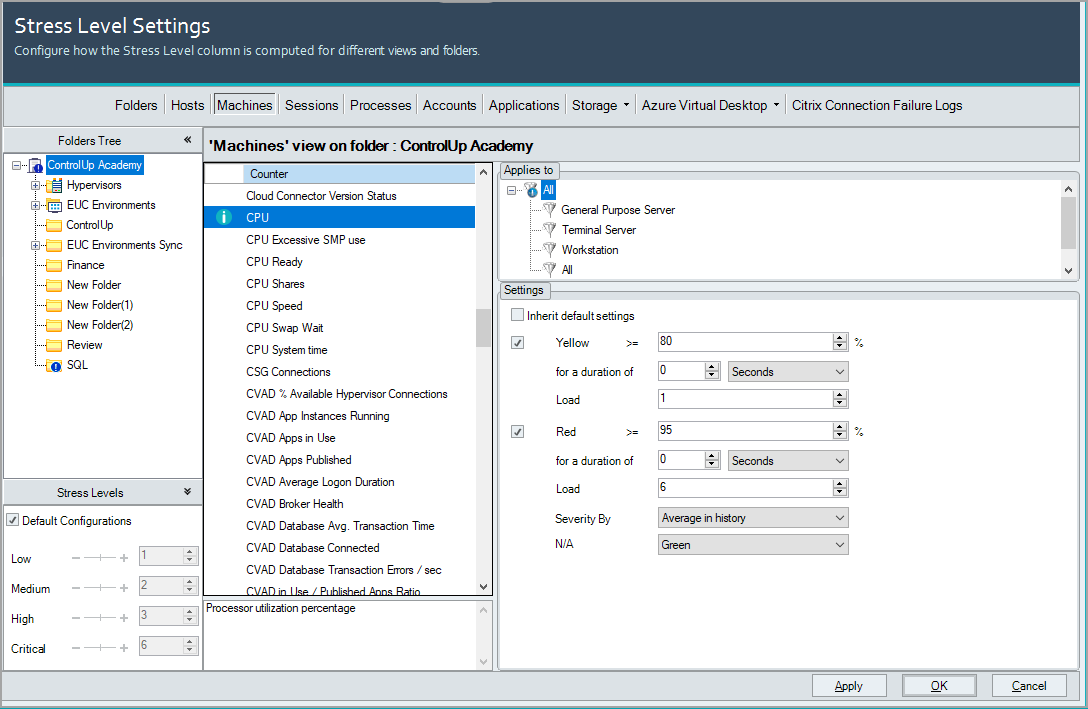
Every counter has a Yellow and a Red zone, with configurable numeric thresholds. In the example above, a machine CPU column’s default settings are 80% for Yellow and 95% for Red. Once a machine’s CPU usage climbs to 80%, the cell in its CPU column will become Yellow. If the CPU usage drops below 80% again, this cell will go back to Green. These changes in the grid should be instantaneous.
Some counters (such as Free Disk Space) have reverse zone thresholds, i.e. Red values will be lower than Yellow values, since in these cases a lower value indicates a more severe condition.
Duration
Once a Yellow or a Red threshold is crossed, ControlUp tracks the time the value of the counter stays above that threshold. You can configure the console to increase the resource’s Stress Level when this occurs, specifying how long the value should stay above the threshold.
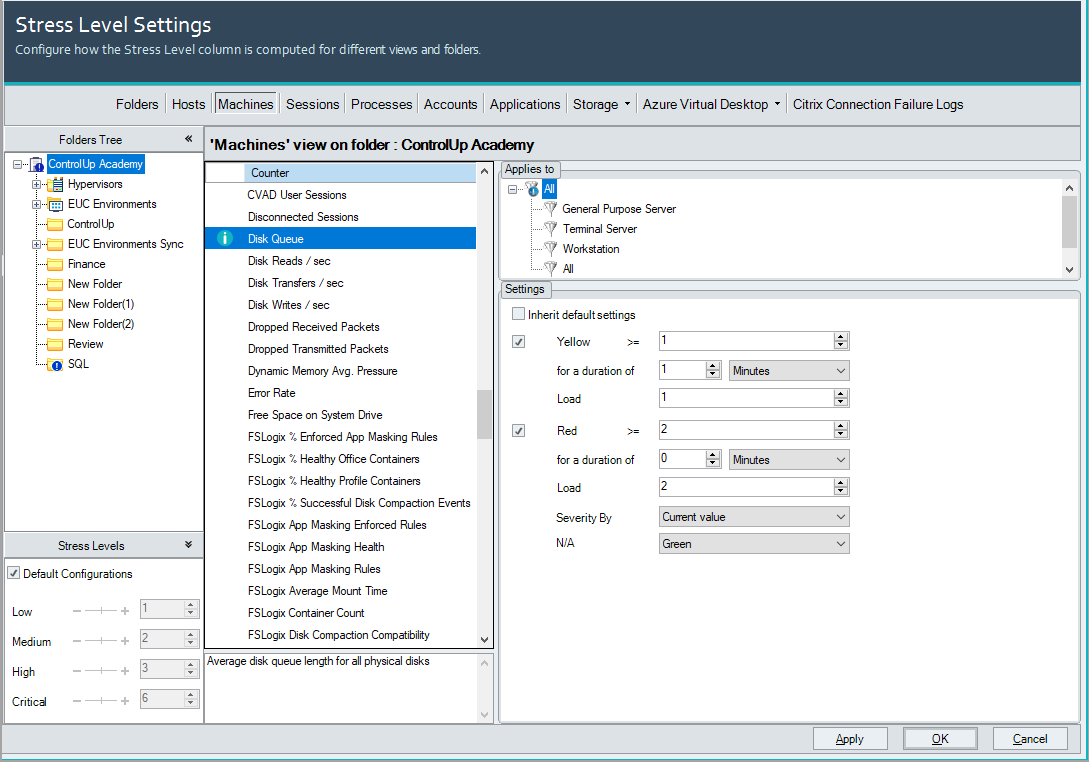
For example, you decide that if a machine’s Disk Queue value exceeds 1 for over 1 minute, it might indicate an I/O bottleneck and should affect the machine’s Stress Level. If the value exceeds 2 for a over 1 minute, it might indicate a severe I/O issue to be displayed in Red, as shown below:
Load
The Load value determines how many points should be added to the value of the record’s Stress Level column when a threshold is crossed for the time duration you configured. In the Disk Queue example above, if the value stays between 1 and 2 for a minute, the Stress Level will be incremented by 1 point. If the value is above 2, the Stress Level will be incremented by 2 points.
Severity By
To change the value used by the information grid to display the performance data of a column and modify its color accordingly, select a computation method from the Severity by drop-down list. The following values are available:
- Current Value. Most current point value of the counter. This is recommended for counters such as Memory Utilization or Free Space on System Drive, where knowing the real-time data is essential.
- Max. Maximum value recorded in the counter since its sampling started. Valuable for peak analysis and capacity planning.
- Min. Minimum value recorded in the counter since its sampling started.
ControlUp’s performance counters maintain a buffer of samples that were significantly different from previous samples. The number of stored values depends on the variance of the sample. If you change the default computation method for columns, note that In History values are computed in relation to more recently received data.
- Max In History. Maximum value of the counter’s current buffer.
- Average. Average value computed on all values recorded by the counter since its sampling started. Valuable for long-term analysis and establishing baselines.
- Average In History. Average value of the counter’s current buffer. Valuable for rapidly fluctuating counters, such as Pages Faults /sec and CPU.
To illustrate the usage of the above values, consider the case of a machine’s CPU column. If you select Average In History in the Severity by drop-down list, you might view a situation where the counter will be colored red, while its displayed value is in the green range. This is because the displayed value is based on the current value (e.g. 5%), while the severity color code is based upon the Average In History value, which might be high (e.g. 90%). This type of configuration makes sense in most environments, since a momentary peak of CPU usage is usually no cause for alarm. While a prolonged CPU load detected by the Average In History value can indicate a performance issue, and justifies a color coded severity alert.
We recommend that you take extreme care when customizing the counter thresholds and their calculation sources. It is best practice to consider the variance and fluctuation rate of each counter when planning a change to these values.
N/A Color
Some counters have a complex computation mechanism, which might fail under certain conditions. For example, when a value of a performance counter can't be retrieved. For each of the metrics collected by ControlUp, you can decide that a failure to collect a counter’s value in itself represents an issue, and should change the color of the column to Yellow or Red. For example, CVAD Server Load.
Configuring Stress Level thresholds
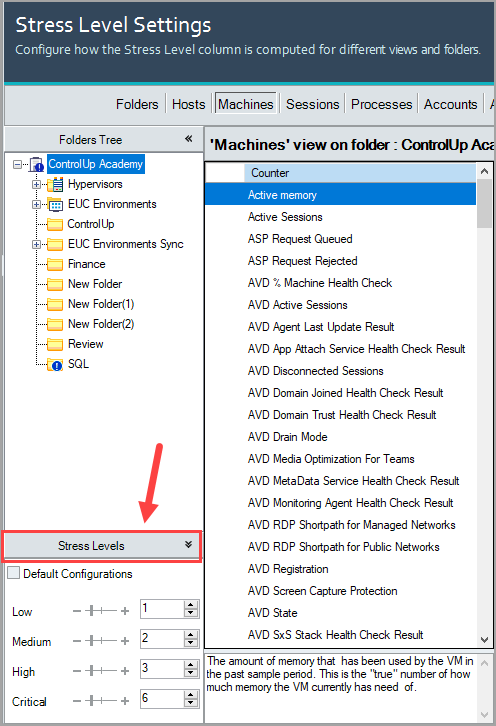
You can customize the numeric Stress Level thresholds panel on the left side of the Stress Settings tab.
By default, all resources in your organization inherit the following default stress levels thresholds:
| Lower Threshold Value | Stress Level | Upper Threshold Value |
|---|---|---|
| (No Stress) | <1 | |
| 1 < | Low | <2 |
| 2 < | Medium | <3 |
| 3 < | High | <6 |
| 6 < | Critical |
Same as the Stress Level computation settings, you can configure these limits on a folder basis. This means that a resource (machine, session, process) with a stress level of 7 can be considered Critical in one folder and Medium in another, according to the needs of your environment.
To customize the Stress Level thresholds for a subfolder:
- From the Stress Level Settings tab, click on the required subfolder in the organization tree.
- Under the Stress Levels area, deselect the Default Configurations checkbox.
- Adjust the numeric thresholds using the sliders or by entering the numbers into the fields corresponding to each level.
- Click Apply > OK.
To reset default Stress Level thresholds for a subfolder:
- From the Stress Level Settings tab, click on the required subfolder in the organization tree.
- Under the Stress Levels area, select the Default Configurations checkbox.
- Click Apply > OK.
Receiving Stress Level Alerts
You can configure the console to alert you when resources in your environment reach a configured stress level. For more information, see here.