In the Usage view, the Environment Assessment report shows the following resource consumption details for the managed machines in the selected folder.
Usage Widgets
- The widgets display an incorrect number of EUC sites.
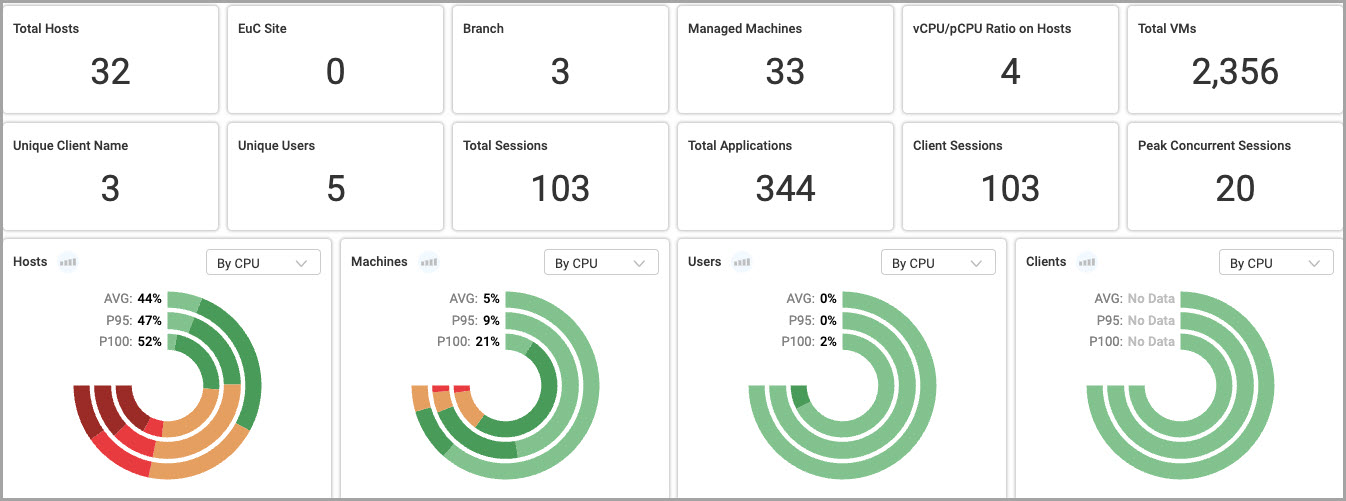
Use the quantitative widgets to gain insights into your network's usage:
- Total Hosts. Total number of virtualization servers that ran VMs that were monitored by the ControlUp Agent. This widget won't display if there are no monitored hypervisors in the selected folder. Click Total Hosts to drilldown to the Hosts Statistics report.
- Total EUC Sites. Total number of EUC sites that were user initiated sessions.
- Total Branches. Total number of branch sites that were user established sessions.
- Managed Machines. Total number of machines that were monitored by the ControlUp Agent. Click Managed Machines to drilldown to the Machine Statistics report.
- vCPU/pCPU Ratio on Hosts. Average ratio of virtual CPUs (vCPUs) to physical cores (pCPUs) on the monitored host machines. This widget won't display if there are no monitored hypervisors in the selected folder.
- Total Running VMs. Highest daily count of VMs that ran on the host machines over the past 30 days. Not the total number of distinct VMs that ran in your organization over the past 30 days.
- Unique Client Names. Total number of client machines (endpoints) that were used by users to establish sessions.
- Unique Users. Total number of distinct users who used client machines to establish sessions.
- Total Sessions. Total number of client sessions that were established by users. Click Total Sessions to drilldown to the Session Activity report.
- Total Applications. Total number of unique applications that users opened. A unique application is a unique combination of a process name (e.g., cmd.exe) and a version number (e.g., 10.014393.0).
- Total Clients. Total number of client sessions that were established by users that were monitored by the ControlUp Real-Time DX Agent.
- Peak Concurrent Sessions. Peak concurrent number of client sessions that were established by users.
The Usage view shows the following donut charts under the quantitative widgets:
- Hosts
- Machines
- Users
- Clients
You can select to view the charts according to CPU or memory. By default, CPU is selected. The charts contains three concentric rings that show the percentage of items according to average (Avg), P95 (95th percentile) and P100 (maximum of average) resource usage utilization. The P95 of resource usage is based on 5-minute granularity and daily aggregation, representing the resource consumption level that was exceeded only 5% of the time. This metric offers a valuable insight into your organization's performance and capacity planning.
Insights Panel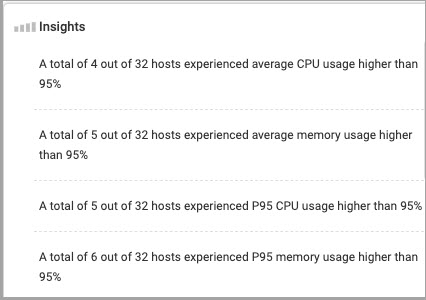
The Insights panel shows summaries of your highest metrics for CPU and memory usage.
High or Exceptional Usage
At the bottom of the Usage view, the following widgets show data about high or exceptional resource usage for each type of resource consumer.
Bar graphs in each widget display the quantities used by the top consumers, listed in descending order. You can select to view a different resource type from the default resource in the dropdown.
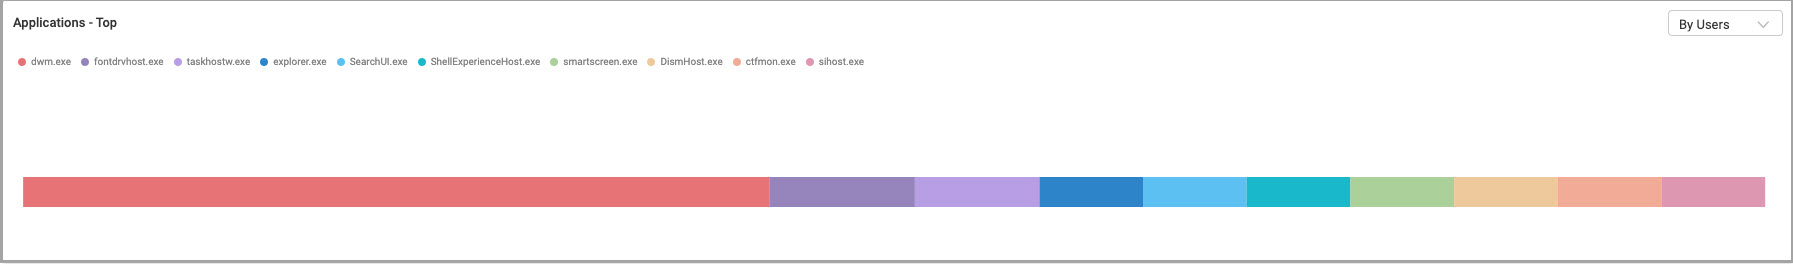
- Applications - Top 10 by Usage. Shows the 10 applications that were used the most by the total number of unique users or instances, based on how many unique instances that the application was opened in the previous month in your organization. By default, Users is the selected view. Each application is represented by a colored bar. The size of each bar indicates how many users or instances opened the application. Hover over a bar to view the exact numbers of users or instances for an application.
- Hosts - Top Consumers. Shows the 10 hosts that consumed the most resources by resource and usage type. By default, CPU is the selected resource type, and Avg is the selected usage type. Hover over a bar to view the exact percentage of resources consumed, number of VMs for a host, disk IOPS, or network Gbps.
- Machines - Top Consumers. Shows the 10 machines that consumed the most resources by resource and usage type. By default, CPU is the selected resource type, and Avg is the selected usage type. Hover over a bar to view the exact percentage of resources consumed, disk IOPS, network Mbps, or number of sessions for a machine.
- Applications - Top Consumers. Shows the 10 applications that consumed the most resources by resource type. By default, CPU is the selected resource type. Hover over a bar to view the exact percentage of resources consumed by an application, amount of memory GB, I/O IOPS, disk MB/s, or network Mbps.
- Users - Top Consumers. Shows the 10 users who consumed the most resources by resource type. By default, CPU is the selected resource type. Hover over a bar to view the exact percentage of CPU consumed by a user or amount of memory GB.