Our support team requires the Data Usage Report to create an Insights On-Premises (IOP) license for your organization. After you create a report, you send a screenshot of it to our support team and they generate a new license. The following article walks you through the steps to create the report for both standalone and cluster IOP machines.
Create a Data Usage Report on a Standalone IOP Server
-
Open a browser and enter the following URL with your IOP Server IP:
https://< IOP Server IP >:8000/iop_ui/en-US/app/search/dashboards -
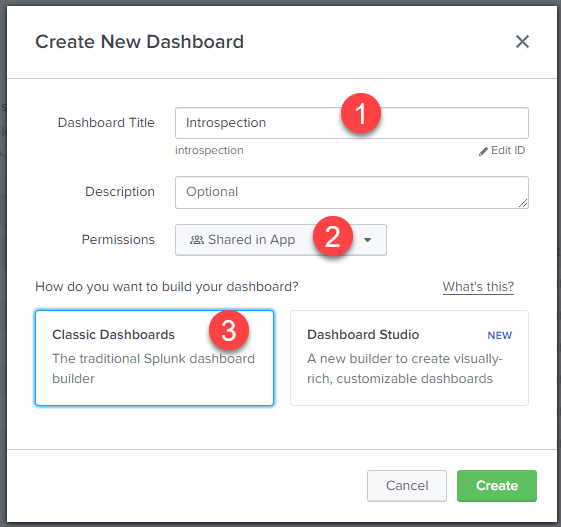
Click Create New Dashboard.
-
In the Create New Dashboard window, enter a title for the dashboard (1), select Shared in App from the Permissions drop-down (2), select Classic Dashboards (3), and click Create.
-
Click Source.
-
Delete the current text and paste the following:
<dashboard>
  <label>Introspection-Report</label>
  <row>
    <panel>
      <table>
        <search>
          <query>| tstats dc(computer_name) as computer_count
           sum(usersessions_max) as session_count
           WHERE `computer_base`
           by _time span=5min
       | timechart span=1d eval(round(max(session_count),0)) as Max_Concurrent_Sessions
                 eval(round(avg(session_count),0)) as Avg_Concurrent_Sessions
                 max(computer_count) as Computers
       | appendcols [
         | tstats dc(session_object_guid) as Total_Sessions WHERE `session_base` by _time span=1d
       ]
       | join _time [
         search index=_internal source="*license_usage.log" type=Usage
         | stats sum(b) as idx_bytes by st,_time
         | eval idx_MB = idx_bytes/(1024*1024)
         | eval sourcetype = st
         | timechart span=1d eval(round(sum(idx_MB),2)) as License
       ]
       | foreach *  [ eval "Per_Session_License"=round((License/Total_Sessions),2) ]
       | table _time Total_Sessions, Max_Concurrent_Sessions, Avg_Concurrent_Sessions, Computers, Per_Session_License, License</query>
          <earliest>-14d@h</earliest>
          <latest>now</latest>
          <sampleRatio>1</sampleRatio>
        </search>
        <option name="count">20</option>
        <option name="dataOverlayMode">none</option>
        <option name="drilldown">none</option>
        <option name="percentagesRow">false</option>
        <option name="rowNumbers">false</option>
        <option name="totalsRow">false</option>
        <option name="wrap">true</option>
      </table>
    </panel>
  </row>
</dashboard>
- Click Save.
The report is added to the Dashboards page:
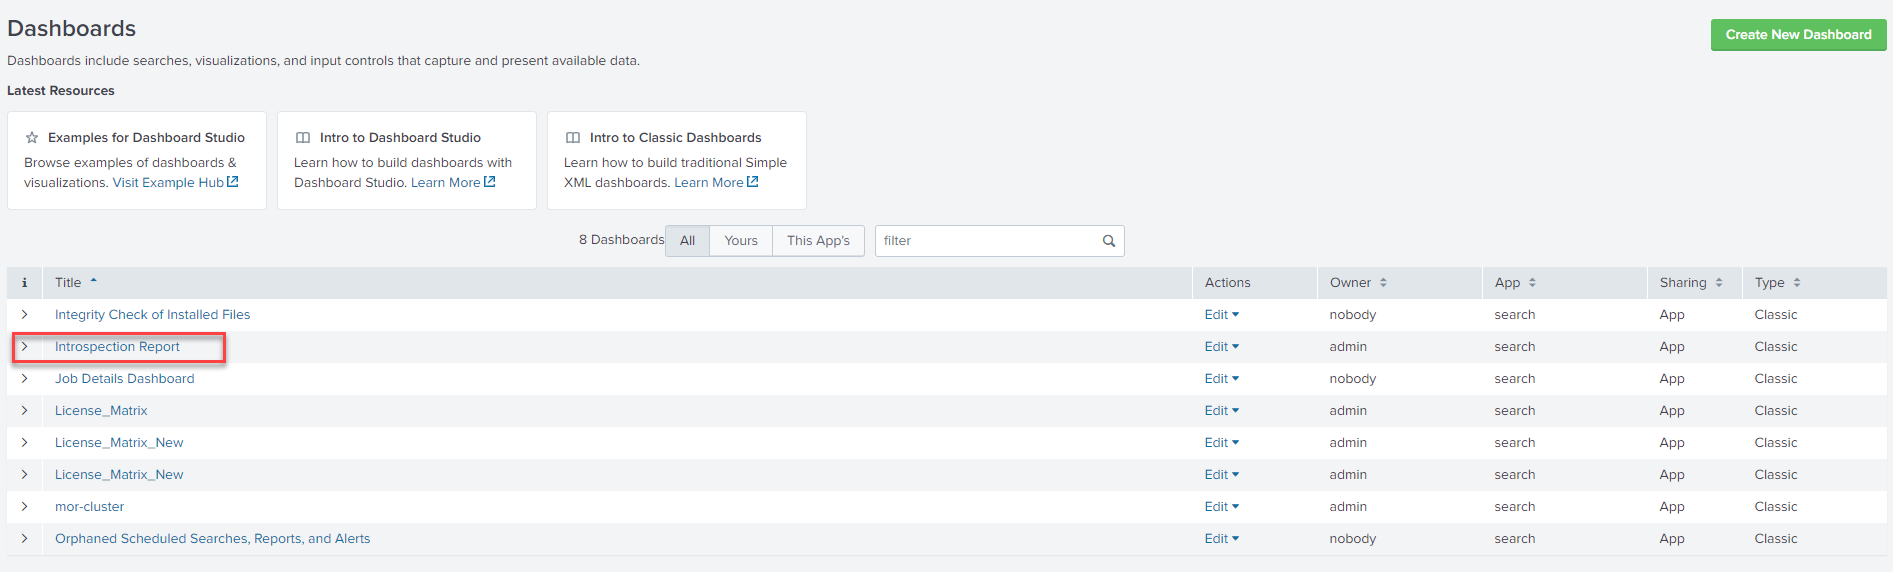
You can now open the report and send a screenshot to us at support@controlup.com. After you send a screenshot, our support team sends you a new IOP license.
Create a Data Usage Report on a Cluster IOP Server
Creating a report on a cluster machine is similar to creating a report on a standalone machine.
-
Open a browser and enter the following URL with your IOP Master Node IP:
https://< IOP Master Node IP >:8080/iop_ui/en-US/app/search/dashboards -
Click Create New Dashboard.
-
In the Create New Dashboard window, enter a title for the dashboard (1), select Shared in App from the Permissions drop-down (2), select Classic Dashboards (3), and click Create.
-
Click Source.
-
Delete the current text and paste the following:
<dashboard>
 <label>Introspection Report</label>
 <row>
   <panel>
     <table>
       <search>
         <query>| tstats dc(computer_name) as computer_count
                    sum(usersessions_max) as session_count
                    WHERE index=computers_iop sourcetype = cuiop:computer_se
                    by _time span=5min
           | timechart span=1d eval(round(max(session_count),0)) as Max_Concurrent_Sessions
                               eval(round(avg(session_count),0)) as Avg_Concurrent_Sessions
                               max(computer_count) as Computers
           | appendcols [
               | tstats dc(session_object_guid) as Total_Sessions WHERE index=sessions_iop sourcetype = cuiop:session_se by _time span=1d
           ]
           | join _time [
               search index=_internal source="*license_usage.log" type=Usage
               | stats sum(b) as idx_bytes by st,_time
               | eval idx_MB = idx_bytes/(1024*1024)
               | eval sourcetype = st
               | timechart span=1d eval(round(sum(idx_MB),2)) as License
           ]
           | foreach * [ eval "Per_Session_License"=round((License/Total_Sessions),2) ]
           | table _time Total_Sessions, Max_Concurrent_Sessions, Avg_Concurrent_Sessions, Computers, Per_Session_License, License</query>
         <earliest>-14d</earliest>
         <latest>now</latest>
         <sampleRatio>1</sampleRatio>
       </search>
       <option name="count">20</option>
       <option name="dataOverlayMode">none</option>
       <option name="drilldown">none</option>
       <option name="percentagesRow">false</option>
       <option name="refresh.display">progressbar</option>
       <option name="rowNumbers">false</option>
       <option name="totalsRow">false</option>
       <option name="wrap">true</option>
     </table>
   </panel>
 </row>
</dashboard>
- Click Save.
The report is added to the Dashboards page:
You can now open the report and send a screenshot to us at support@controlup.com. After you send a screenshot, our support team sends you a new IOP license.