The Insights On-Premises (IOP) platform offers a variety of useful reports and dashboards to monitor your organization's environment. Depending on the needs of your organization, you might want to add your own reports to your IOP dashboard. In the following article, we show you how to create an IOP custom report.
Prerequisites
- Prepared search query. For query text examples, see here.
Create a Custom Report
-
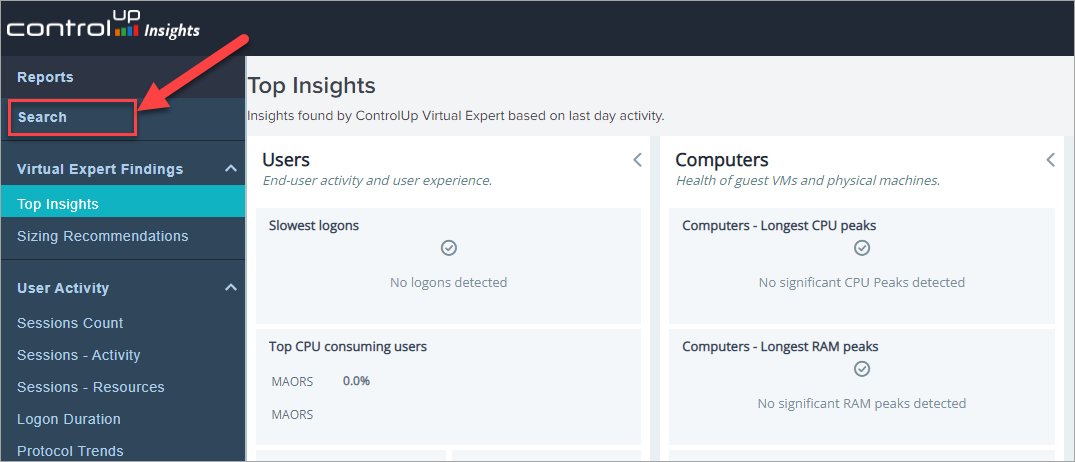
From the IOP navigation bar, under Reports, click Search.
-
Paste your search query into the search box.
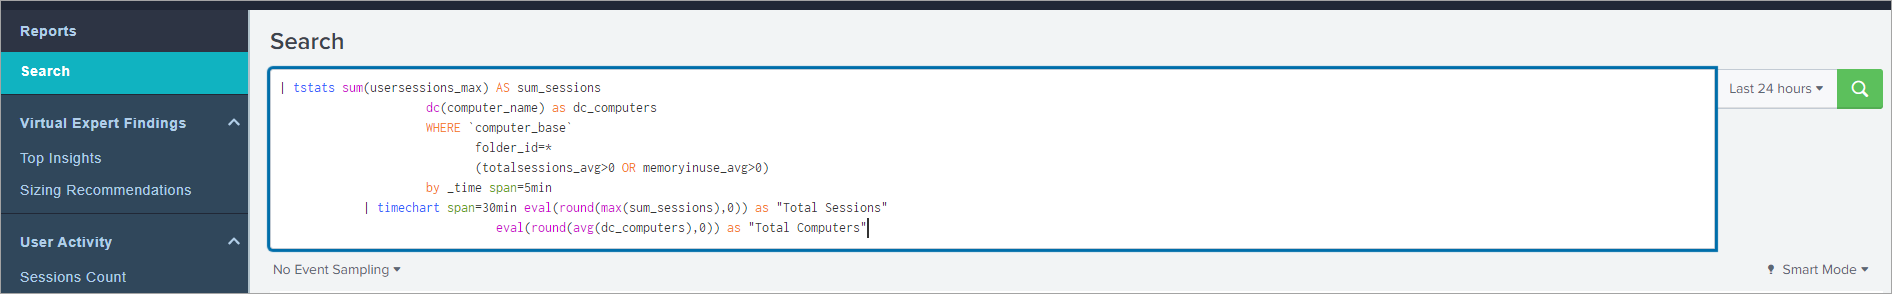
Example search query text:
| tstats sum(usersessions_max) as session_count dc(computer_name) as computer_count WHERE `computer_base` folder_id=* (totalsessions_avg>0 OR memoryinuse_avg>0) by _time span=5min | timechart span=30min eval(round(max(sum_sessions),0)) as "Total Sessions" eval(round(avg(dc_computers),0)) as "Total Computers" -
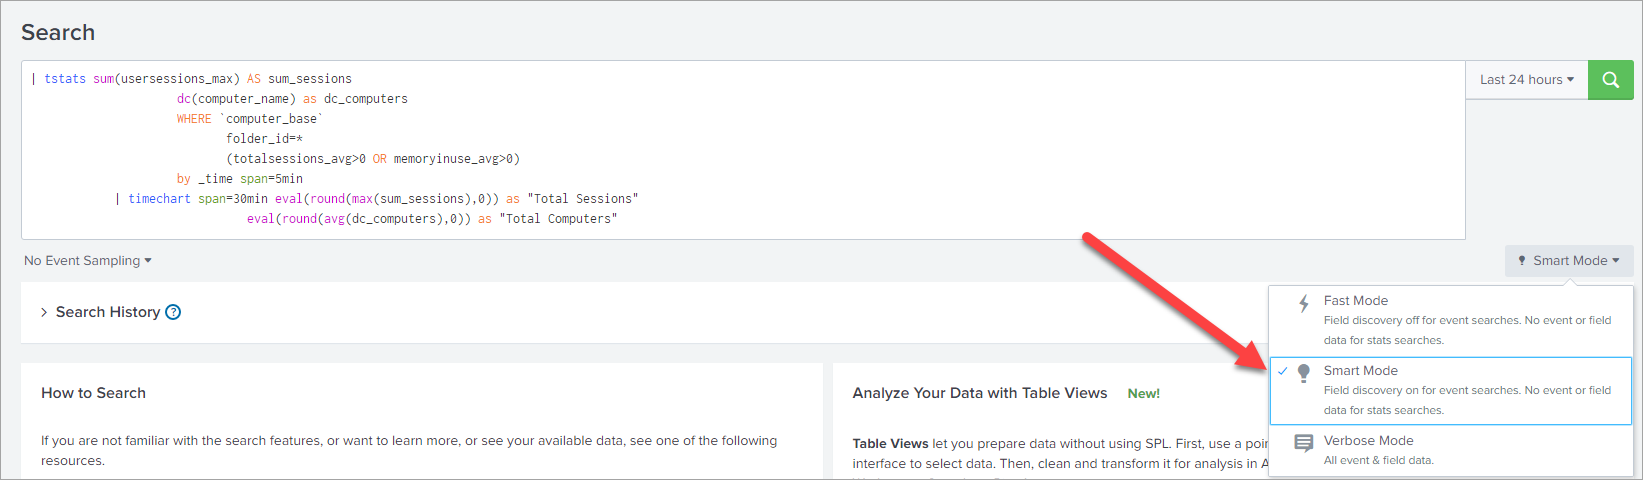
Make sure to select Smart Mode.
-
Click the magnifying icon
 to run the search query.
 -
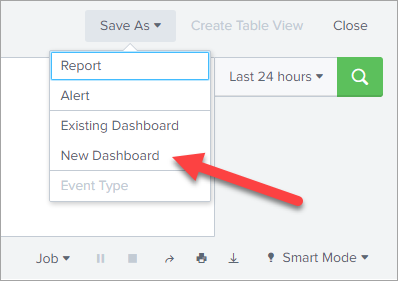
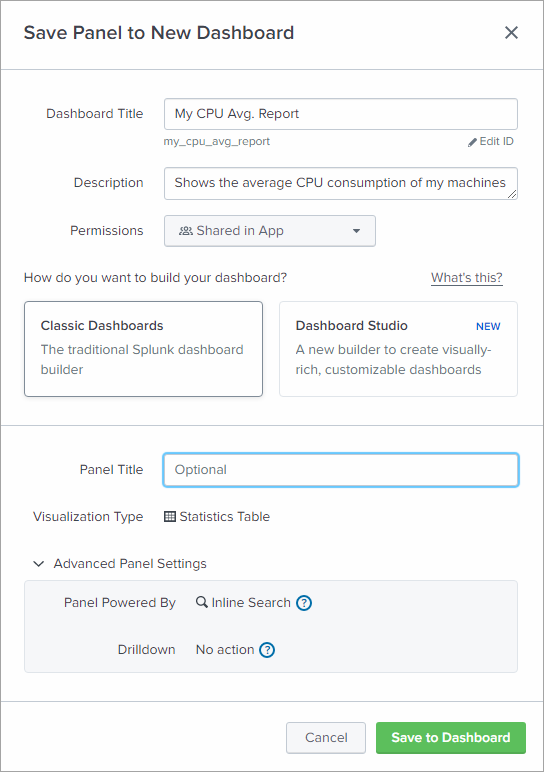
From the Save As dropdown, select New Dashboard.
-
In the Dashboard Title field, enter a title for the dashboard.
-
Copy the ID under the Dashboard Title and click Save to Dashboard.
-
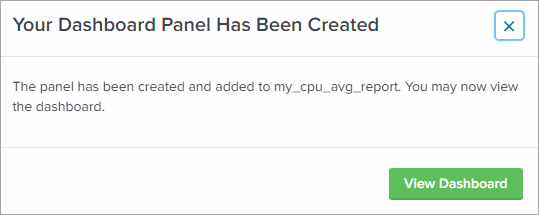
The following message appears after the dashboard is successfully created. Click X to close the message.
-
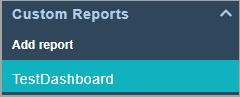
Click Custom Reports > Add report.
-
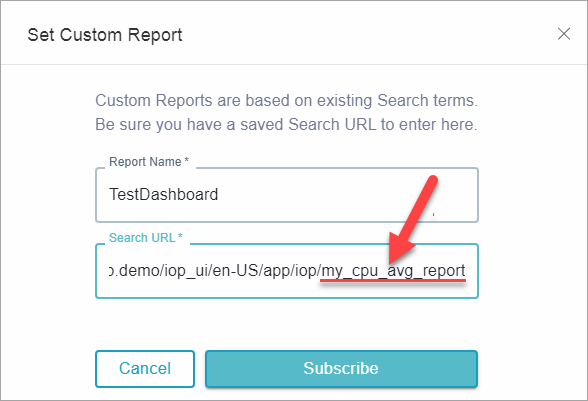
Enter a useful Report Name and paste the dashboard ID you copied to the end of the Search URL field. Click Subscribe.
-
The report is added to the Custom Reports section. Click the report.
-
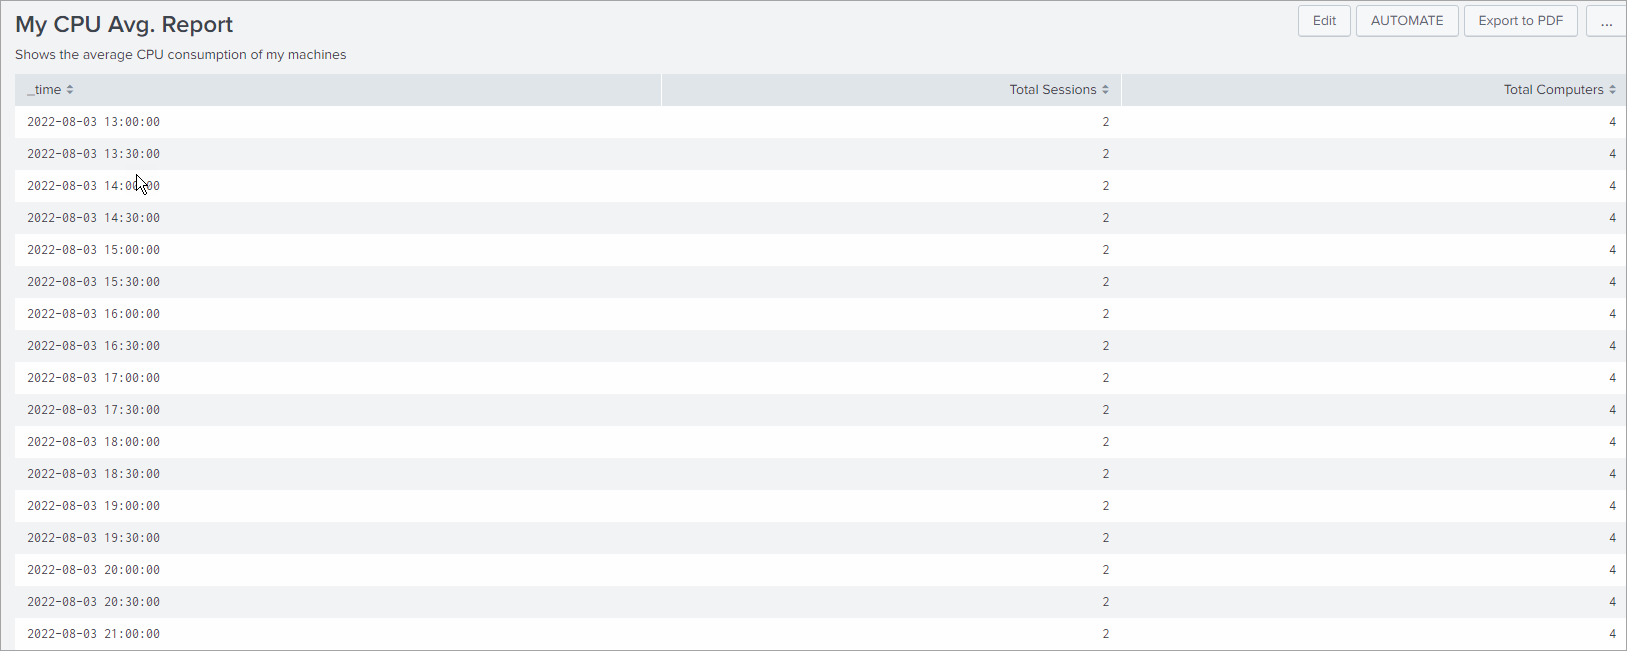
You can now see all associated events that are the results of your search query:
You've created your first custom dashboard that includes one report. You can define as many reports as you want and add them to a dashboard. To limit to specific users only who can view or edit the report, you can further assign permissions to this dashboard.