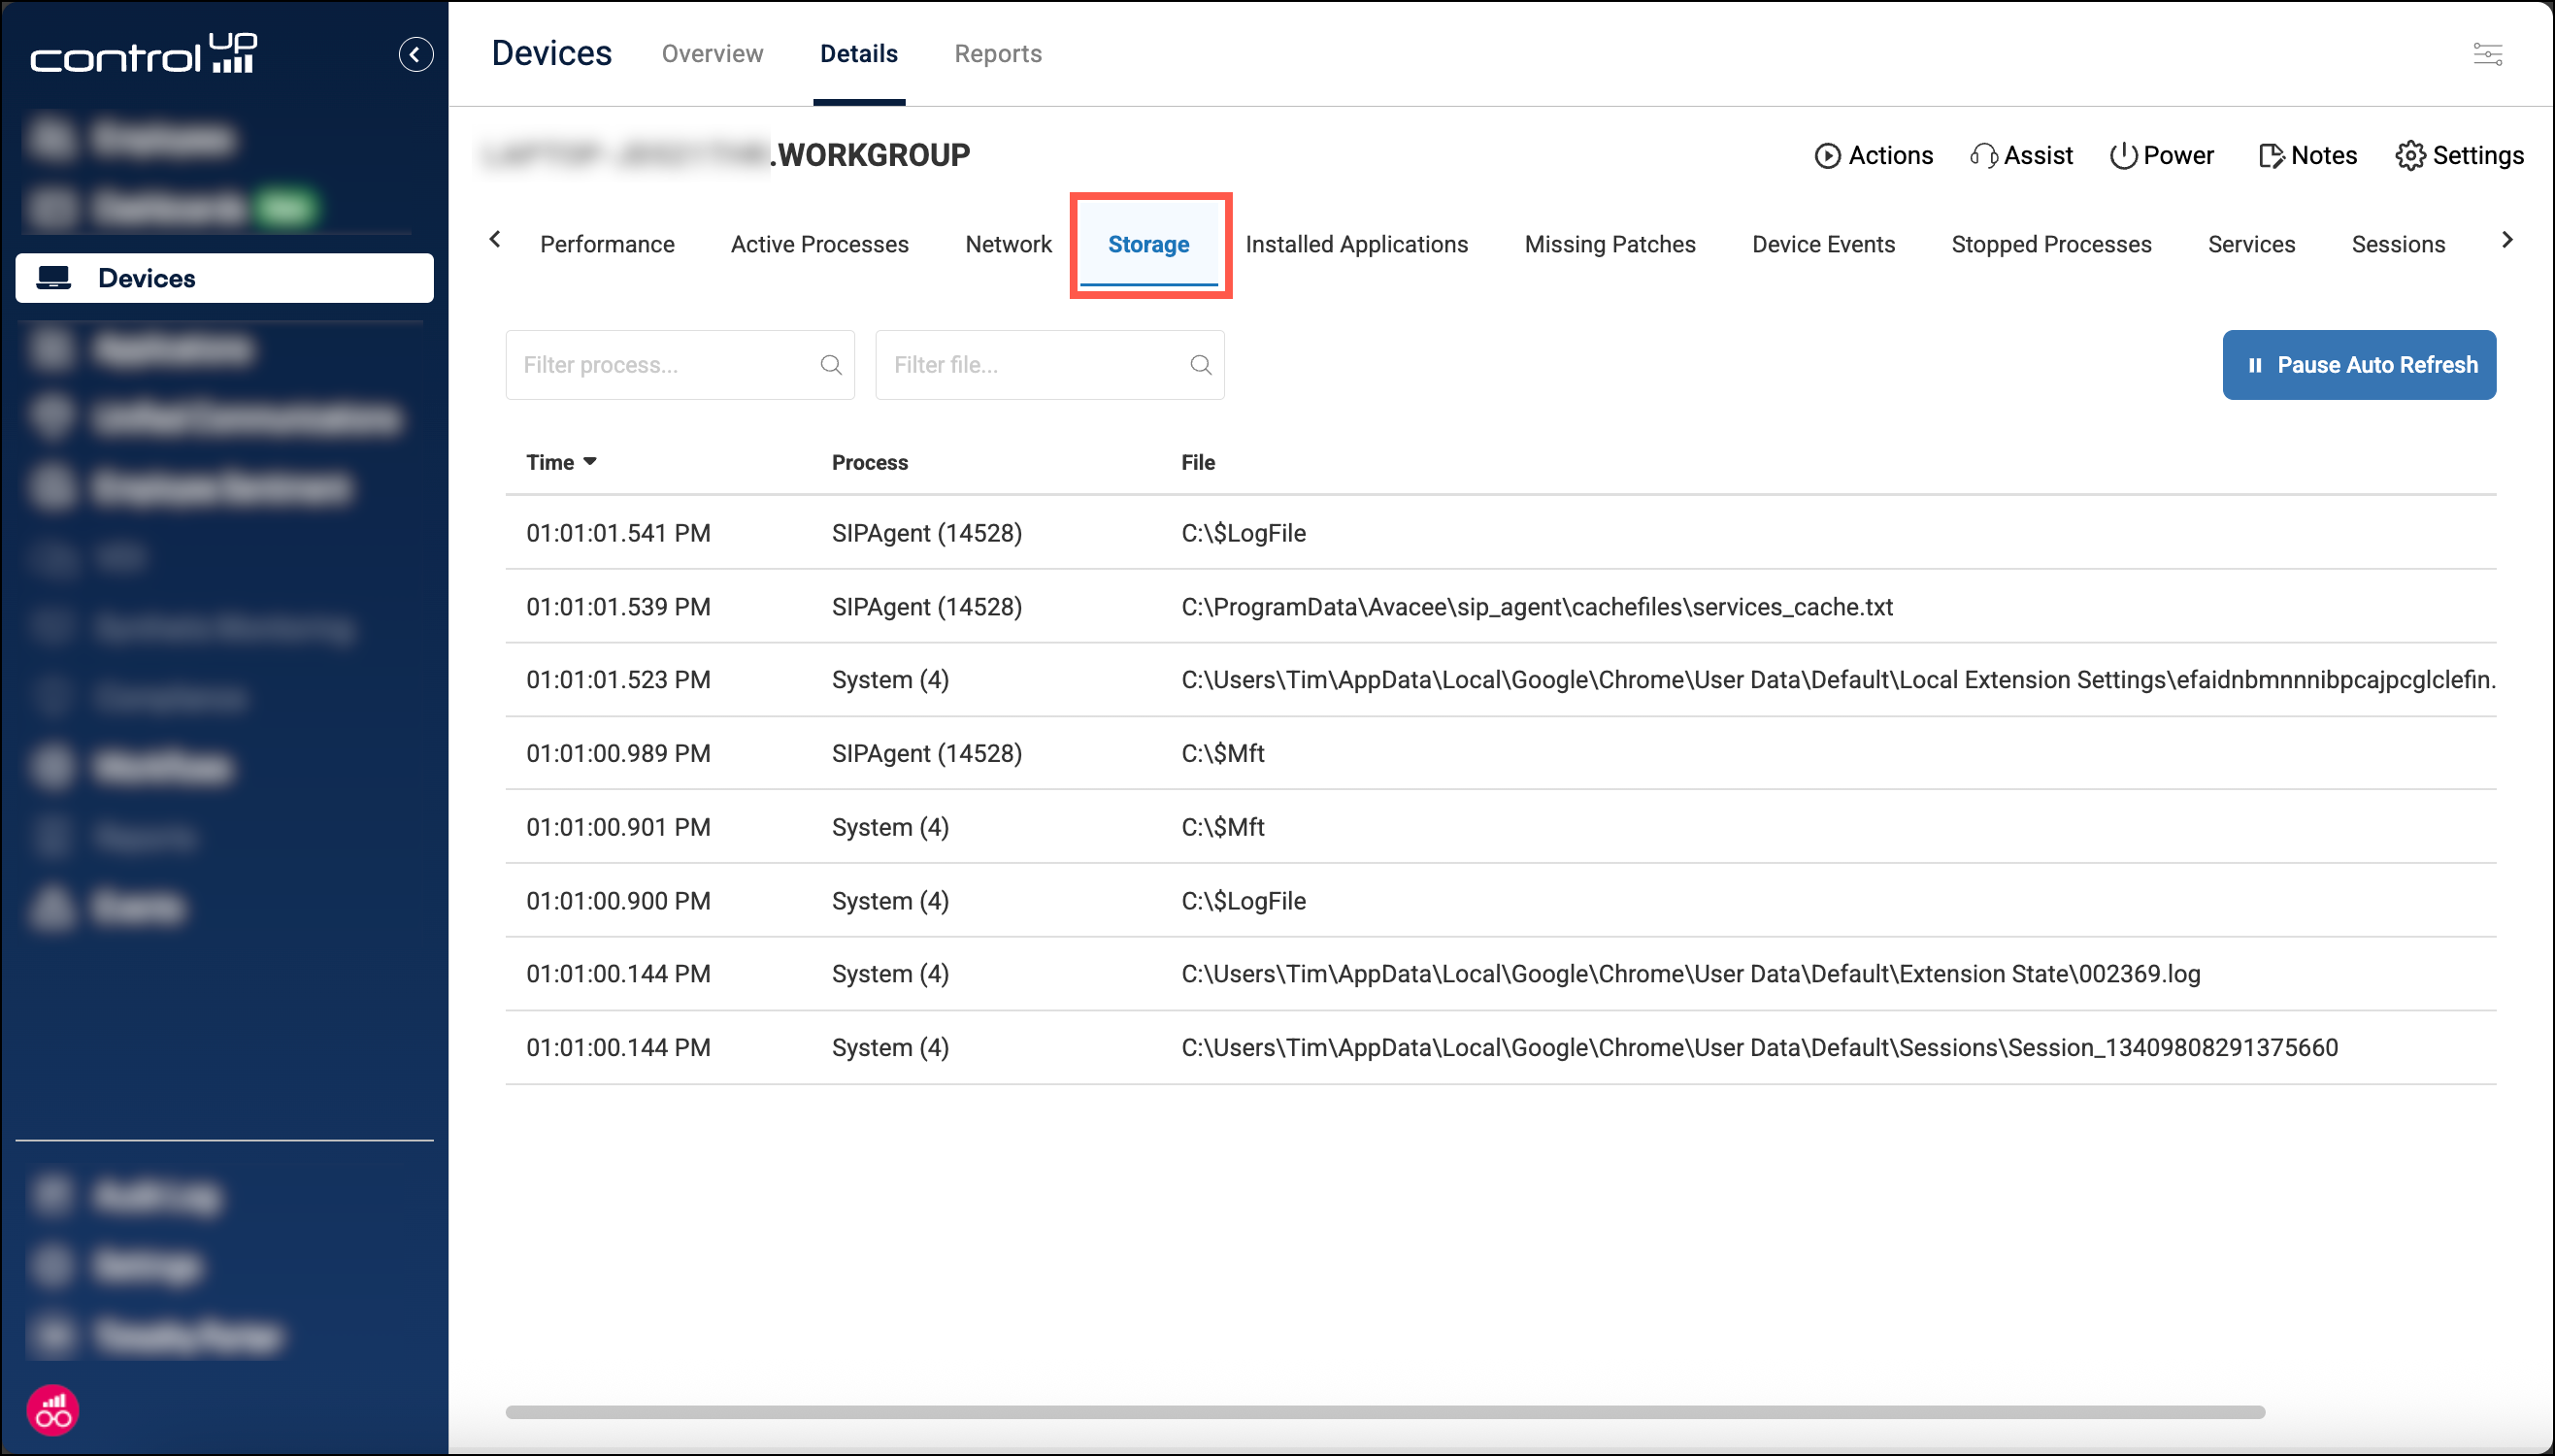
The Storage tab provides a real-time stream of file write operations occurring on the device. This view is essential for diagnosing high disk usage, identifying which files are being modified by specific applications, and auditing file system activity.
Prerequisites
This feature is supported only for Windows devices with Agent version 2.17.7 or higher.
Access storage view
In Devices, drill down into the details for a specific device and select the Storage tab. Note that only one ControlUp user can access the Storage tab for a specific device at any given time.
Permissions
To access the storage tab, you must have the permission Device permissions > Remote Management > Storage.
Data retention and refresh rate
The list is a rolling log of recent activity. It updates every 3 seconds, displaying all file write events captured during that interval.
Buffer Limit: The view retains data for the last 5 minutes or the last 1000 records, whichever limit is reached first.
Pause: You can click Pause Auto Refresh in the top-right corner to freeze the list and analyze specific events without the data scrolling away.
Columns
Time: The precise timestamp of the file write operation, in your browser’s local time zone.
Process: The name and Process ID (PID) of the application initiating the write (e.g.,
chrome (12968)).File: The full path of the file being written to.
Filtering
You can filter the view using the search bars at the top of the Process and File columns. The search supports full wildcard syntax to help you narrow down specific logs.
Example: To find all log files associated with ControlUp, you could enter:
*.controlup*.log
Grouping file write activity
Instead of viewing a continuous log of every individual write event, you can use the Group by option to see cumulative data for specific processes and files.
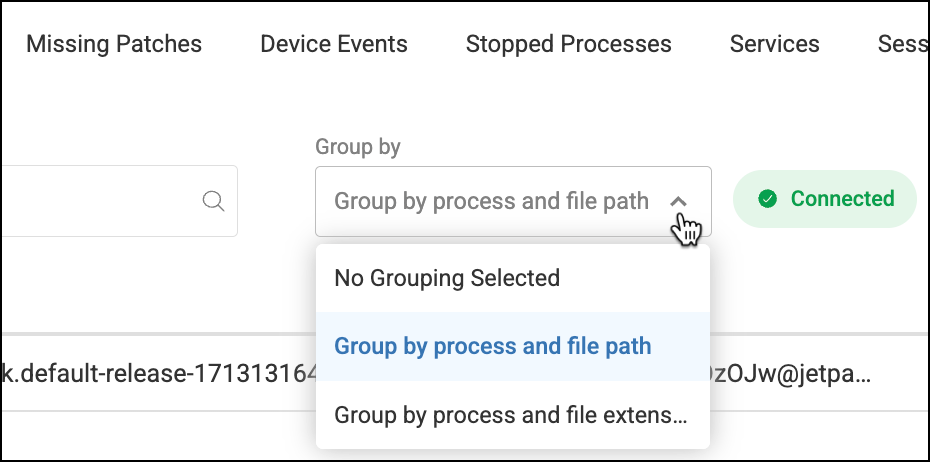
You can select from the following grouping options:
No Grouping Selected: Displays the default rolling log of every individual file write operation as it occurs.
Group by process and file path: Combines all write events that share the same initiating process and target file path. This is ideal for identifying the specific files responsible for the highest volume of disk activity.
Group by process and file extension: Aggregates events by the initiating process and the type of file being written (e.g., .log, .exe, .tmp). This helps you understand what types of files different applications are generating most frequently.
Note: understanding System activity
You may notice a high volume of file writes attributed to the System (4) process. This is often due to how the Windows Operating System handles file caching.
When an application writes data, it often writes to the OS file cache first. The System process then flushes that cache to the physical disk. Consequently, this tool may detect the write operation as originating from "System" rather than the application that originally initiated the request.