The live network connections feature gives you real-time visibility into the TCP network activity of managed devices. These features help you troubleshoot connectivity issues, identify bandwidth bottlenecks, and audit suspicious outbound connections.
Data is refreshed every 3 seconds. You can click Pause Auto Refresh in the top-right corner to freeze the data for easier analysis.
Prerequisites
This feature is supported only for Windows devices with Agent version 2.17.7 or higher.
Access live network connections
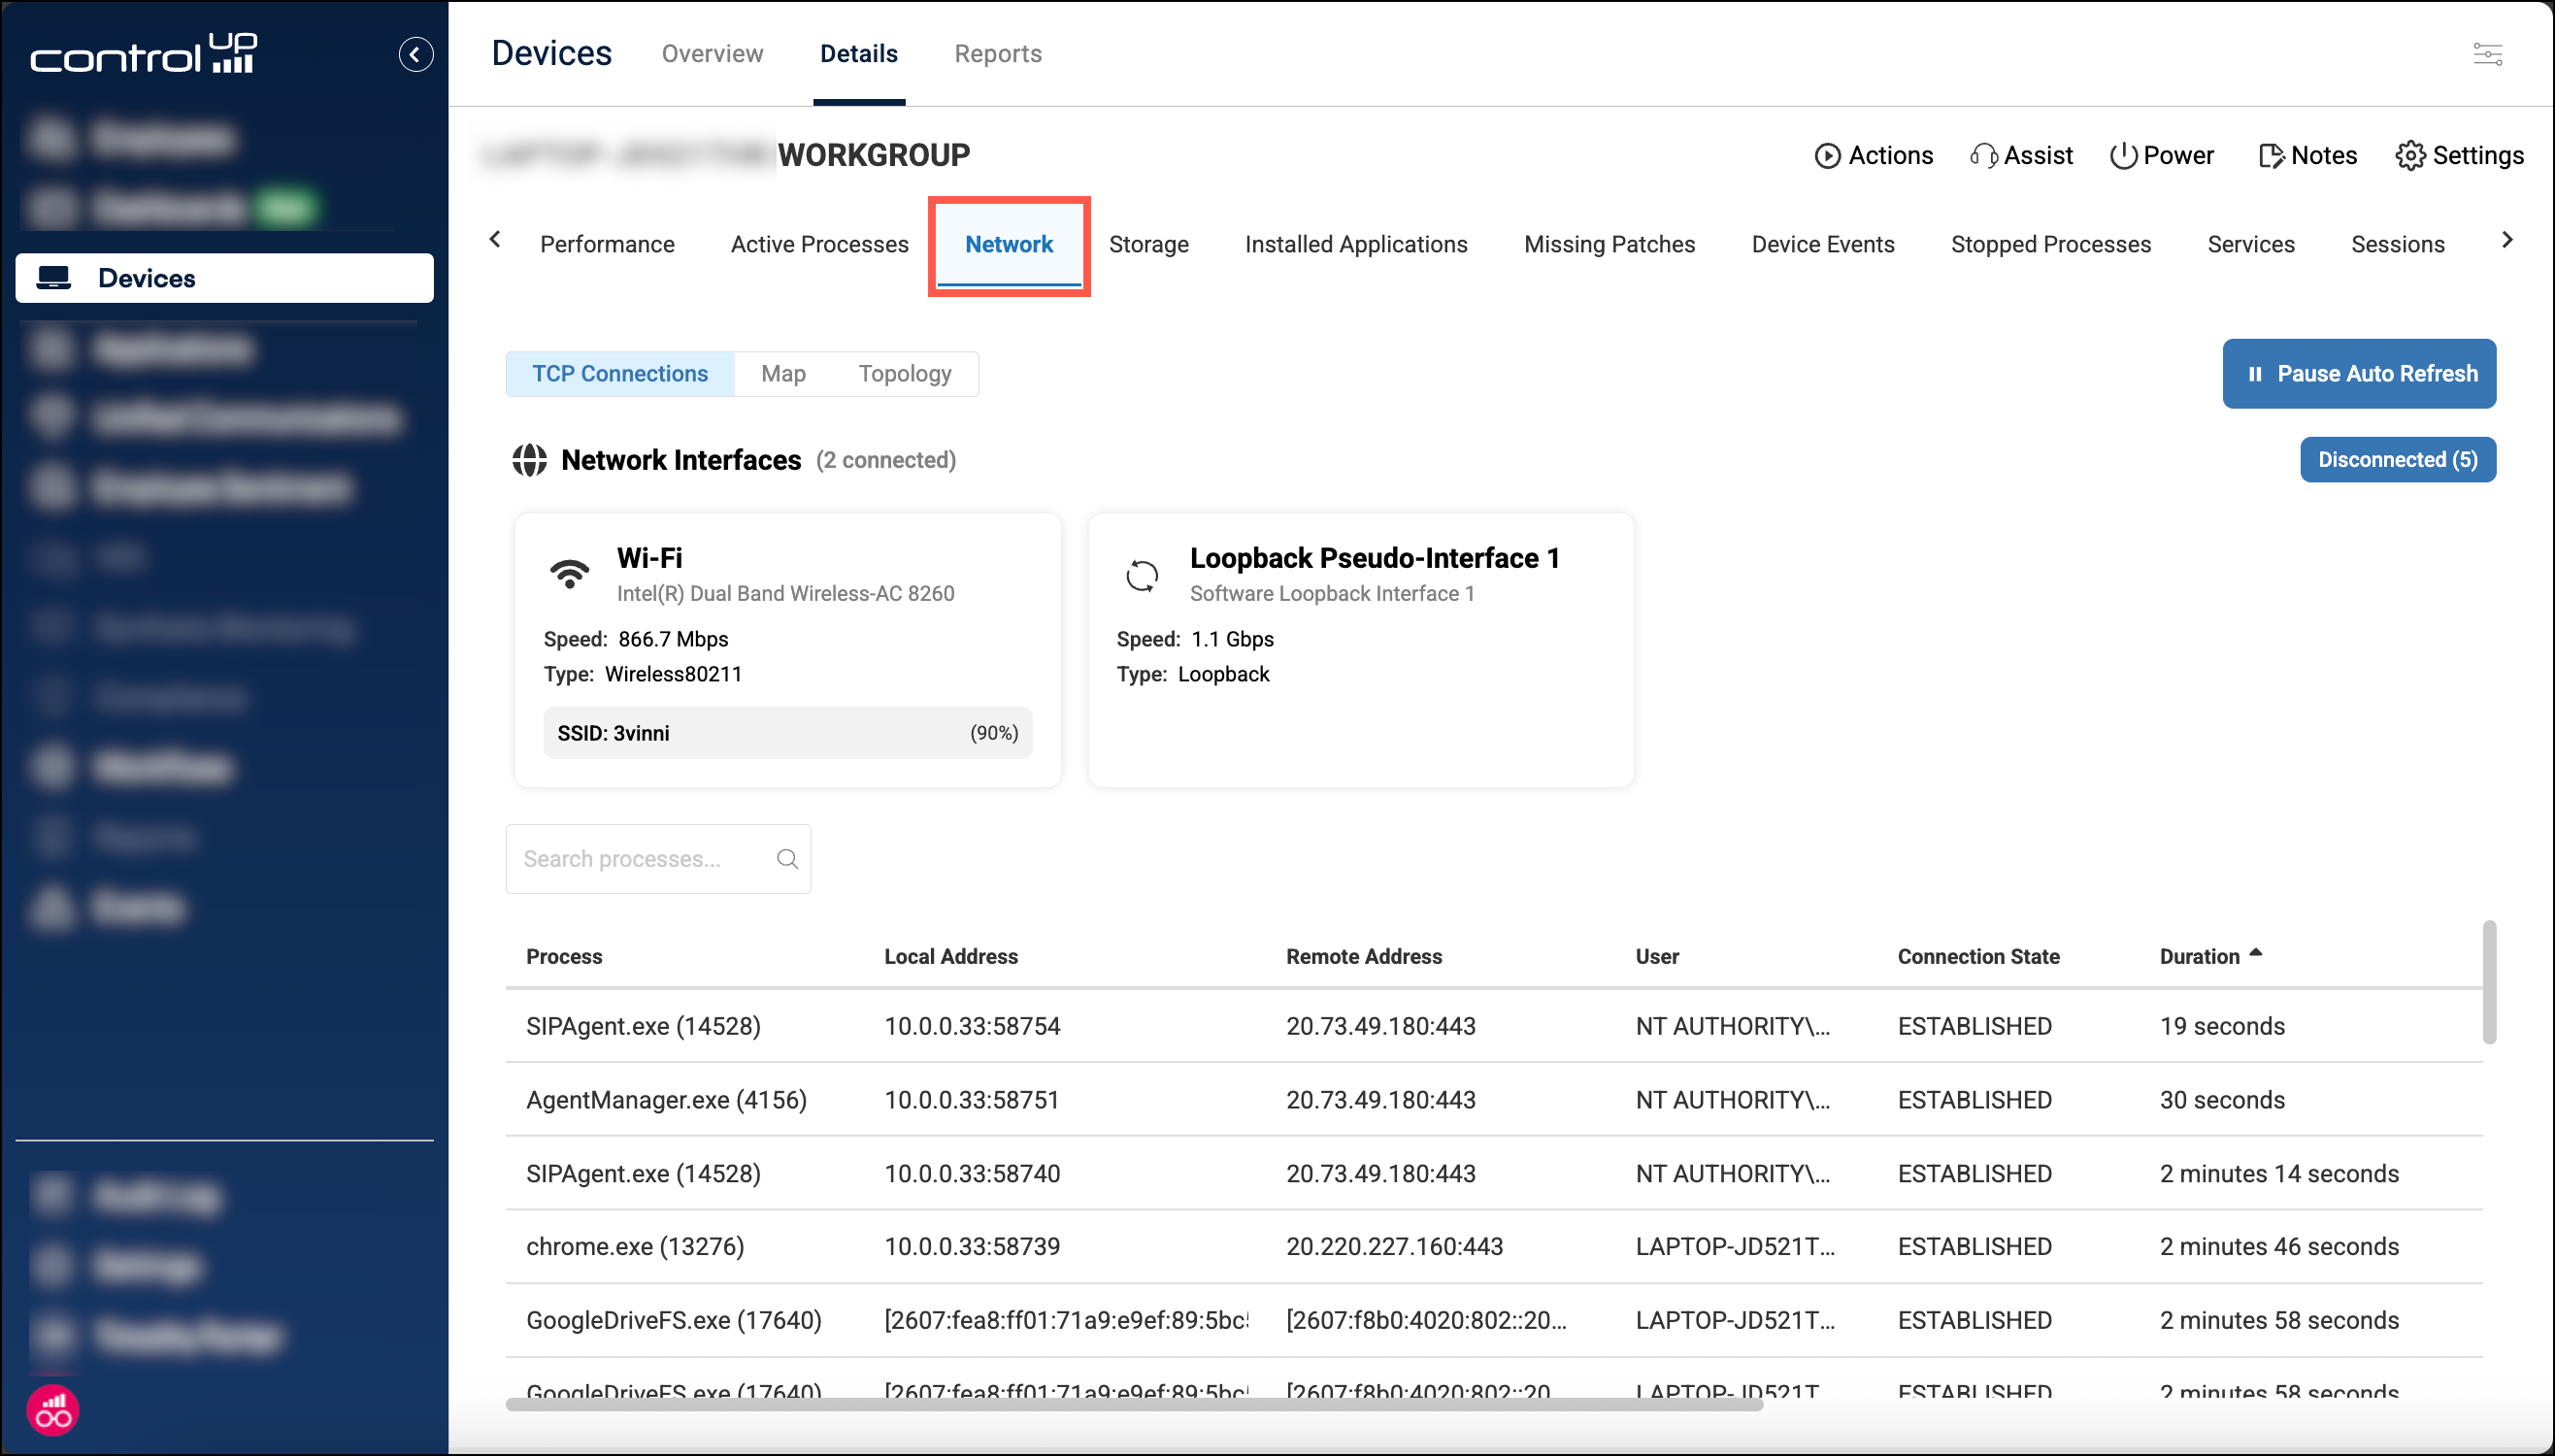
In Devices, drill down into the details for a specific device and select the Network tab. Note that only one ControlUp user can access the file browser for a specific device at any given time.
Permissions
Permissions for this feature are location under Device permissions > Remote Management > Network:
Network Traffic - Allows you to view the TCP Connections and Topology tabs.
Map View - Allows you to view the Map tab.
TCP connections
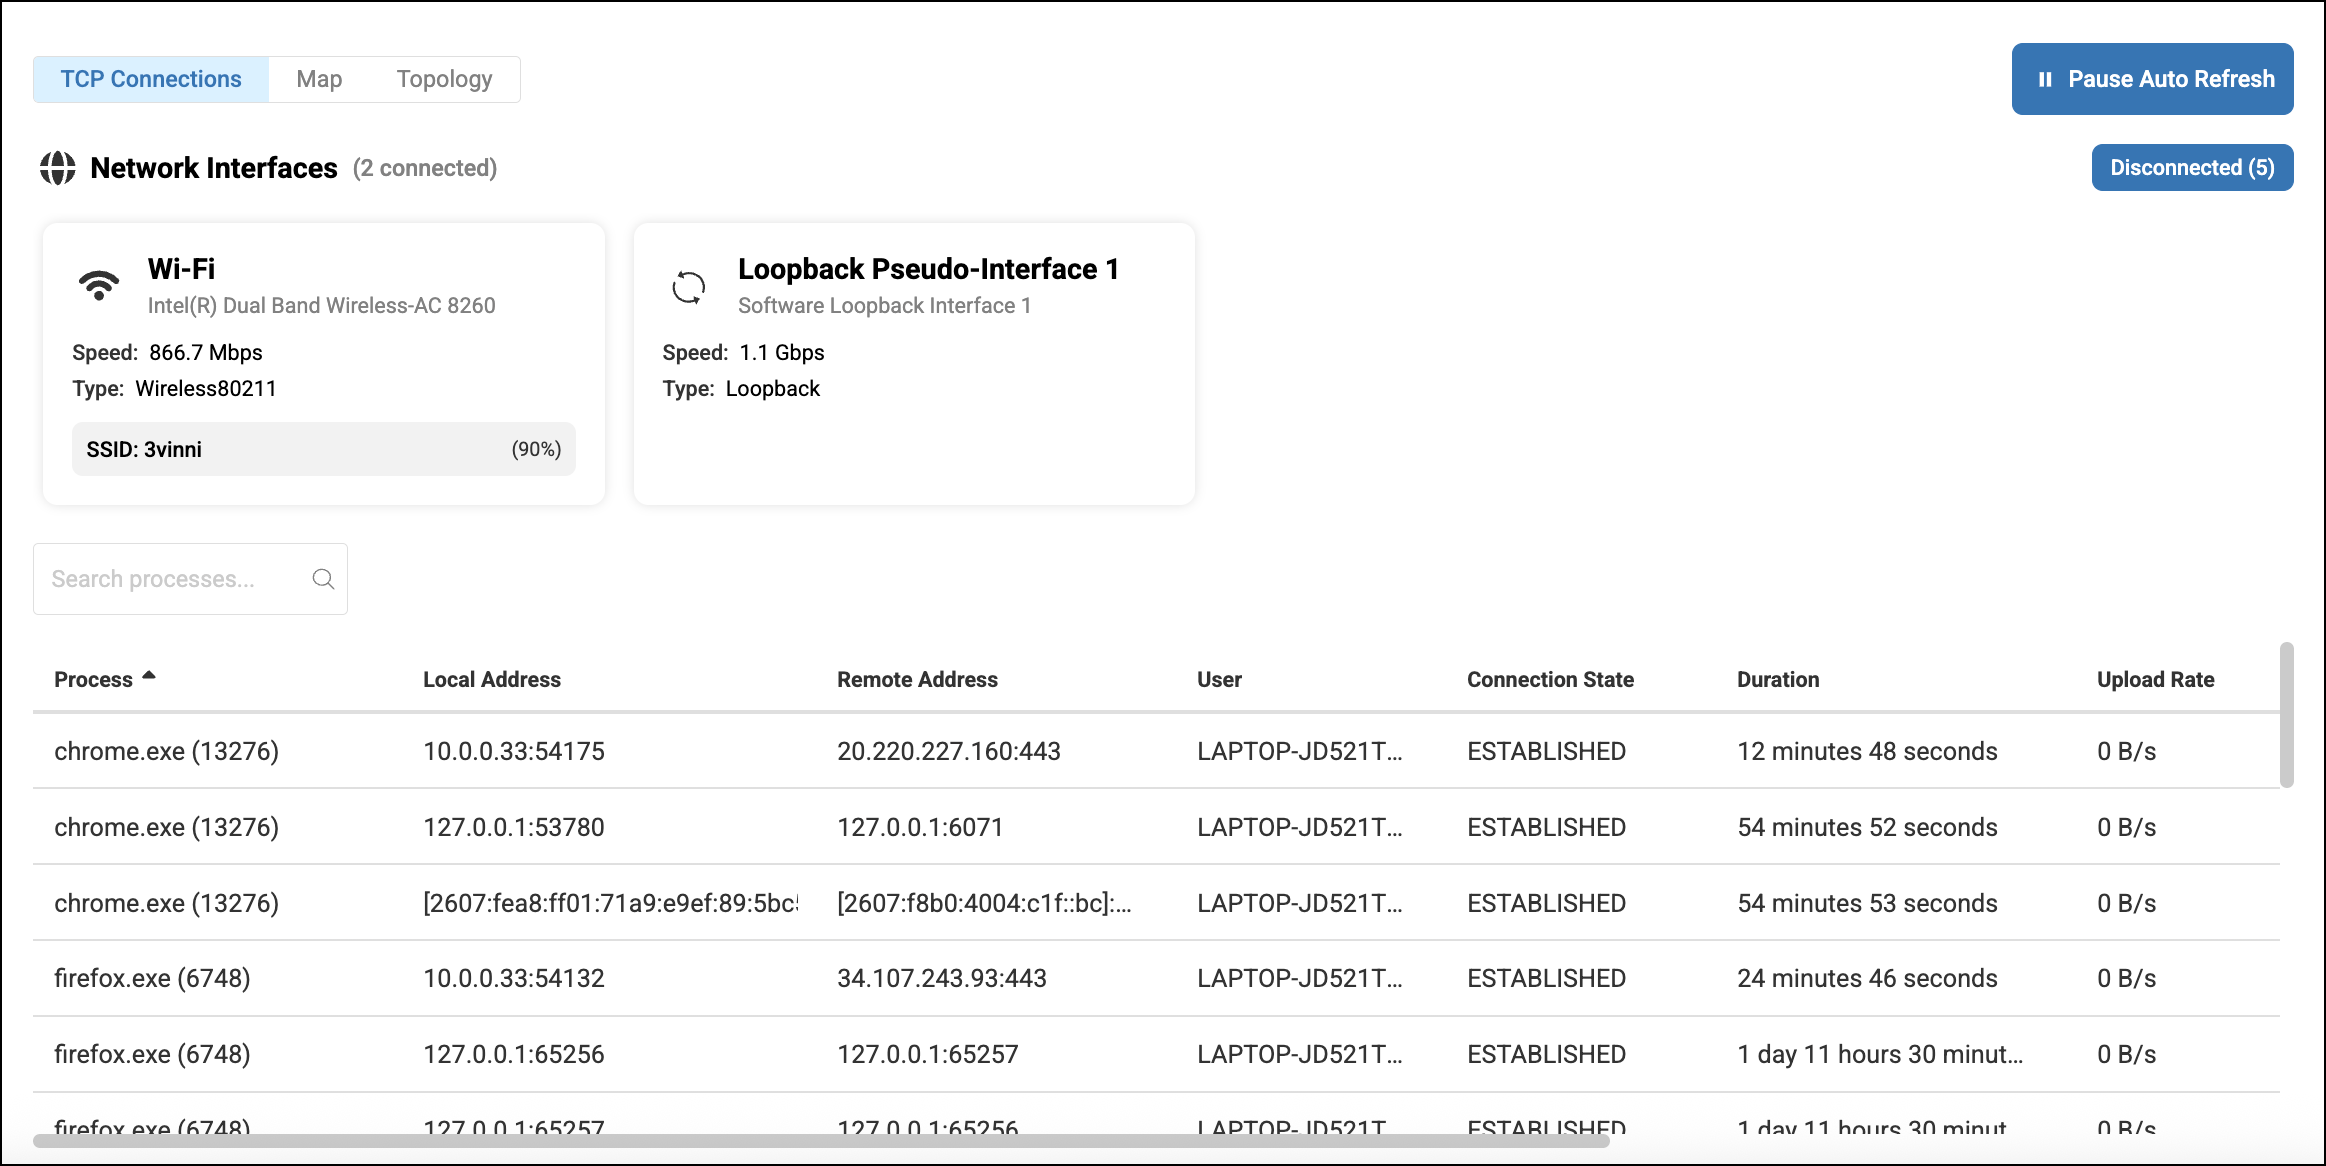
The TCP Connections tab displays:
Details about the device’s connected network interfaces. To see the disconnected interfaces, click Disconnected in the top-right corner.
All active TCP connections from the device. You can sort the columns or search for a specific process by name or process ID.
Network map
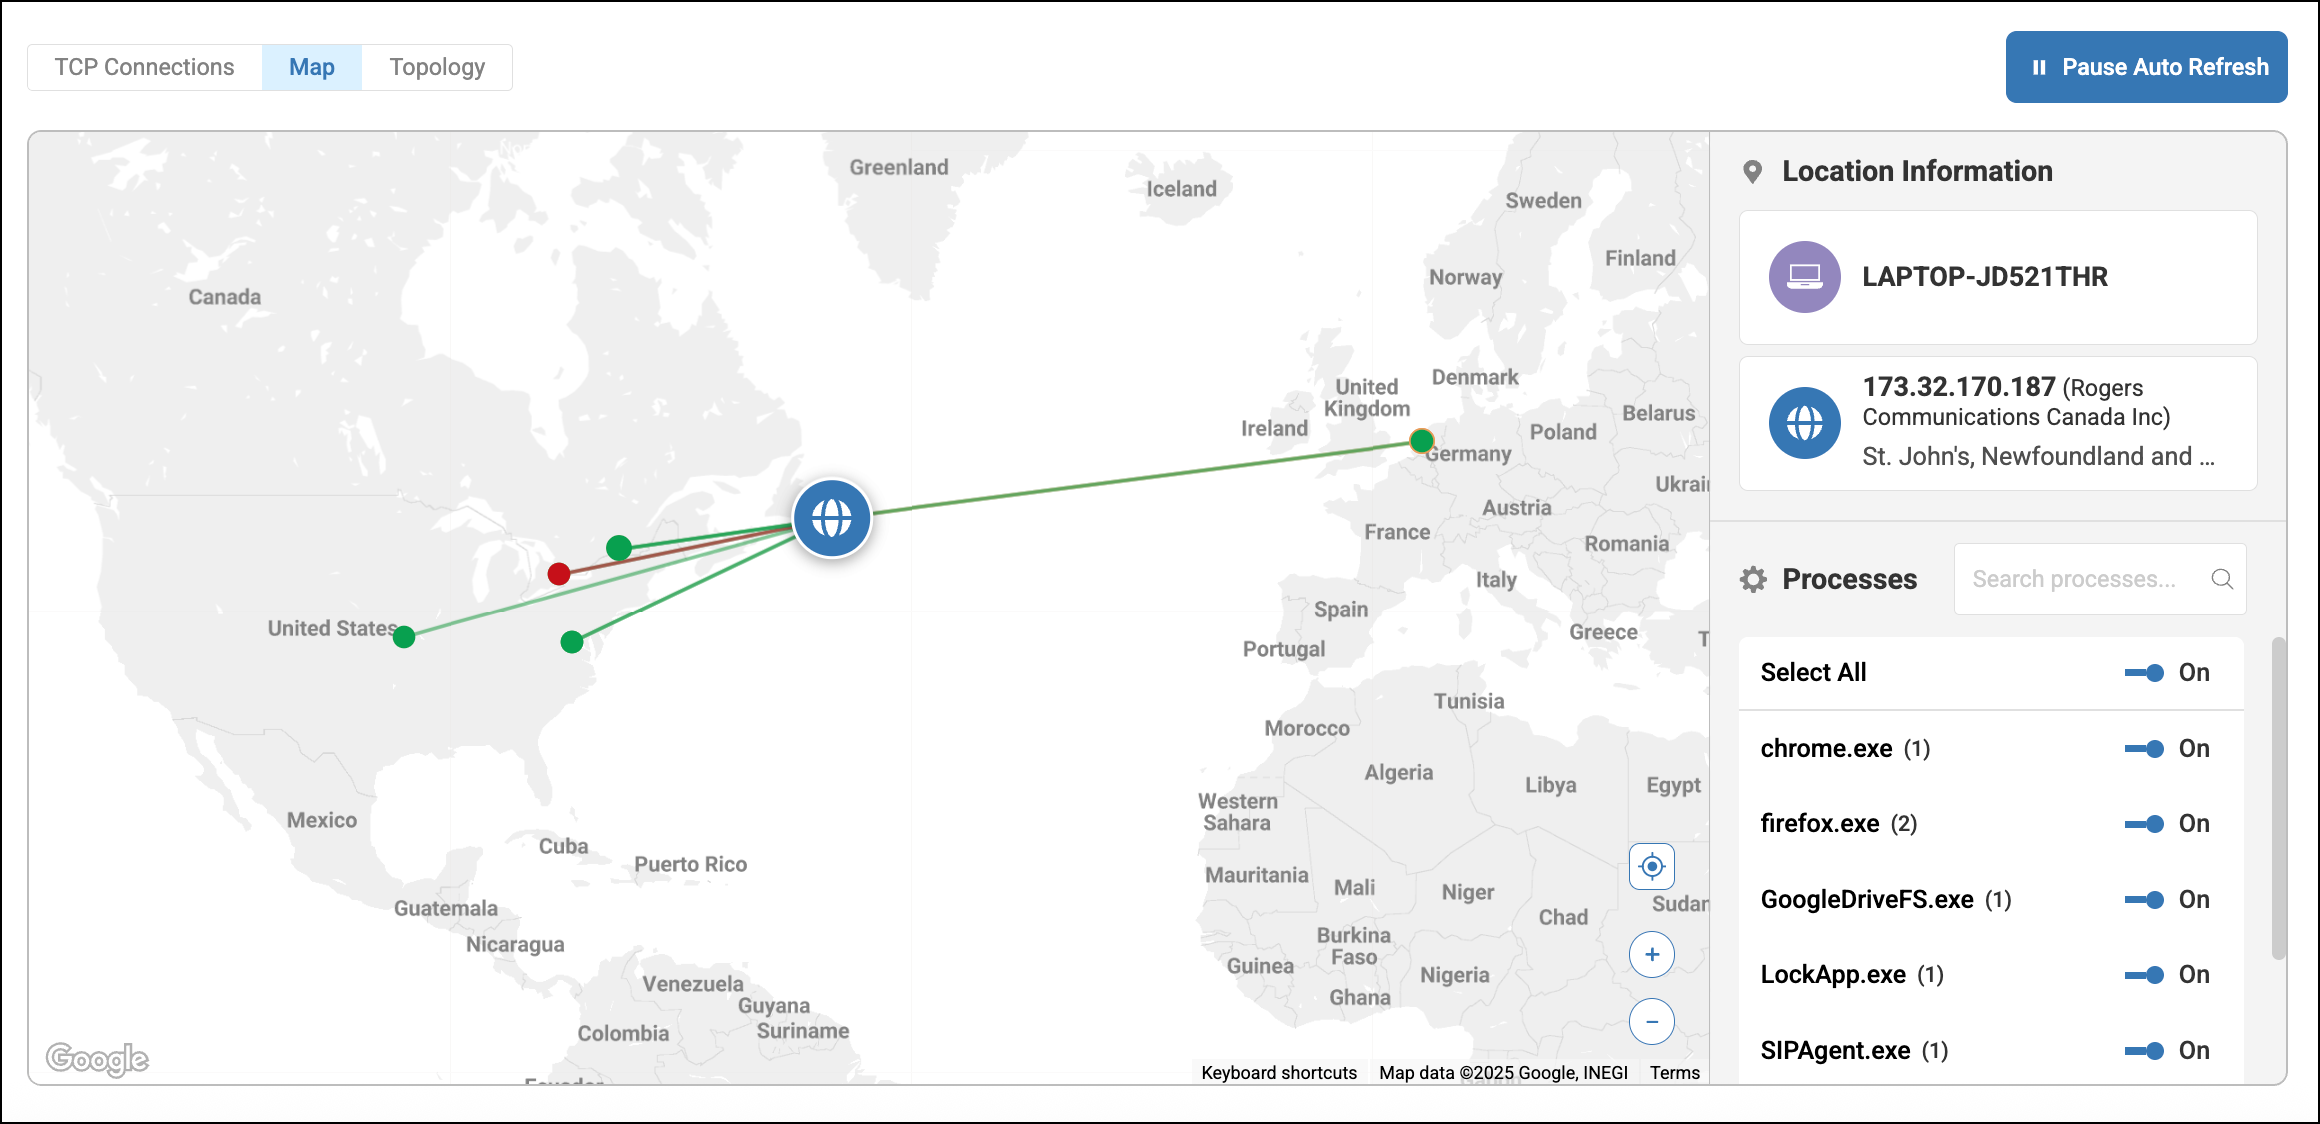
The map shows you the geographical locations of the device, the device’s ISP, and the destination of all network connections.
The color of the connection indicates the latency.
idle = grey
0 - 150ms = green
150 - 250ms = orange
greater than 250ms = red
The size of the connection increases based on the current throughput.
You can click on a connection endpoint in the map to see detailed information.
Filter map by process
If you want to fliter the map to only show connections from certain processes, you can use the toggles next to each process name to show or hide connections from that process.
Network topology
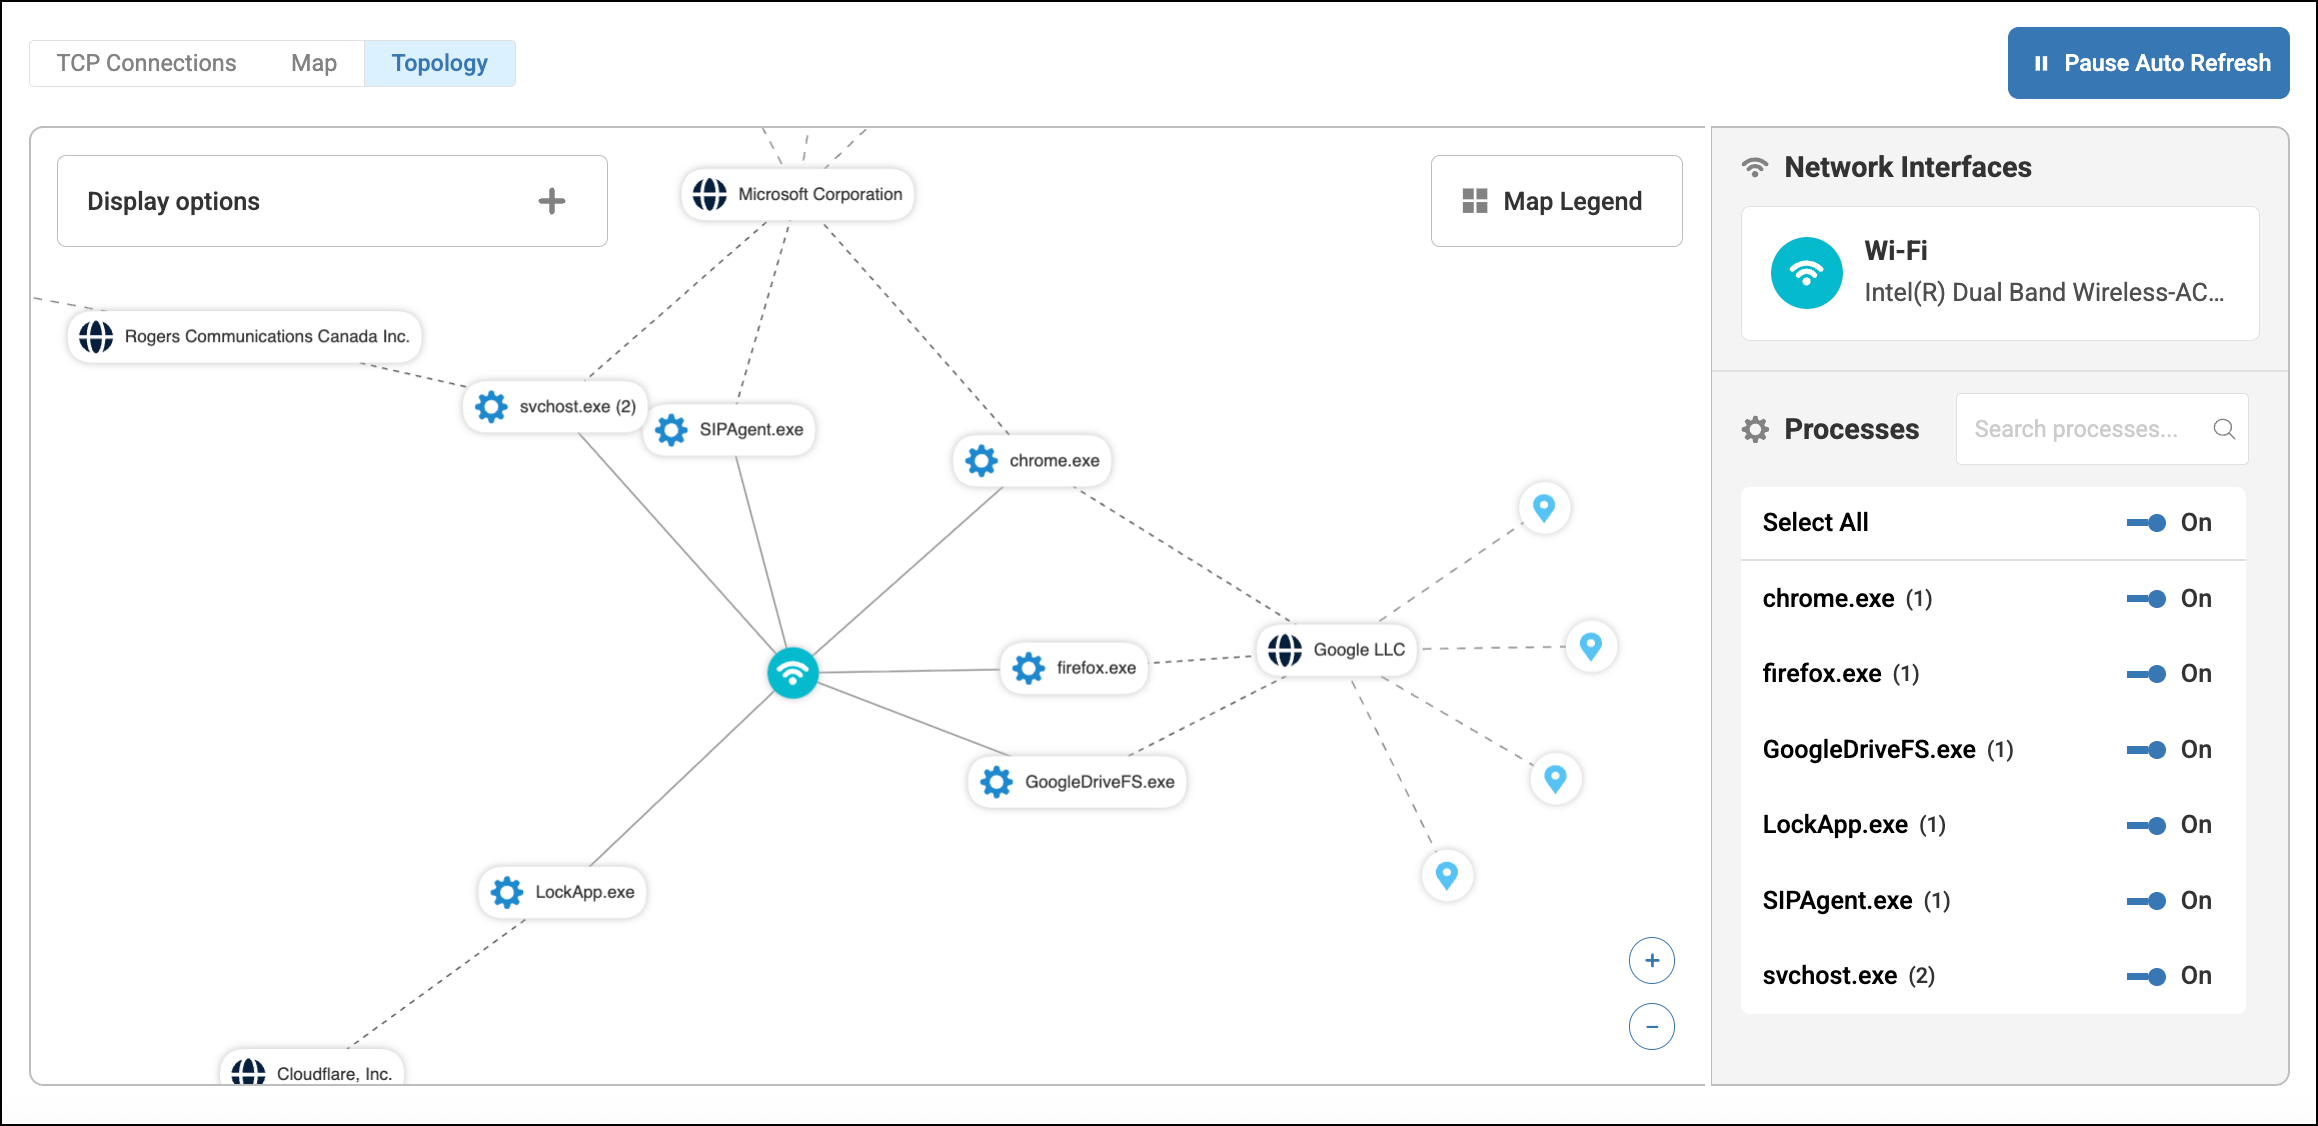
The Topology tab displays the device’s network connections in an interactive topology.
You can see the following node types and the connections between them:
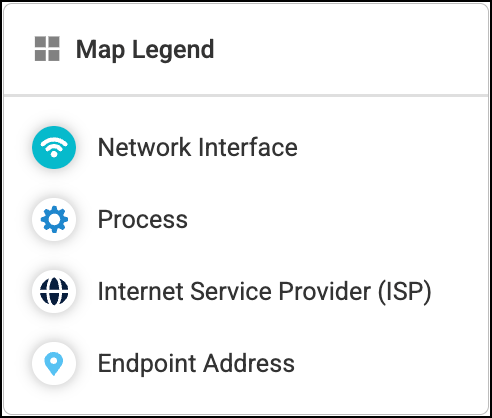
To interact with the toplogy, you can:
Click and drag to adjust layout - Drag a node to a new location to reorganize the topology layout.
View node details - Click on a node to see more detaile information.
Filter by process - Use the toggles next to each process name on the right side of the topology to display or hide connections from that process.
Filter by network interface - If the device has multiple network interfaces, you can select them on the right-side of the topology to show or hide connections from that interface.
Adjust display options - Click Display options in the top-left corner of the topology to configure the following:
Show ISP - Displays or hides ISPs in the topology.
Show Unique Processes - By default, processes with the same name are grouped to reduce clutter. Enable this to see individual PIDs.
Label Visibility - Lets you display or hide the labels (names) for each type of node in the topology. When the label is hidden, you can still hover or click on a node to see its name.