To analyze historical application load times with the Application Load Time Profiler, perform the following steps:
-
Make sure that Application Load Time is enabled in the ControlUp Real-Time DX Console.
a. Open the Console
b. In the Settings menu, click App. Load Time

c. Verify that the Enable application load time measurement by ControlUp Agent checkbox is checked.
d. In the Process Name grid, make sure that the application you wish to monitor is listed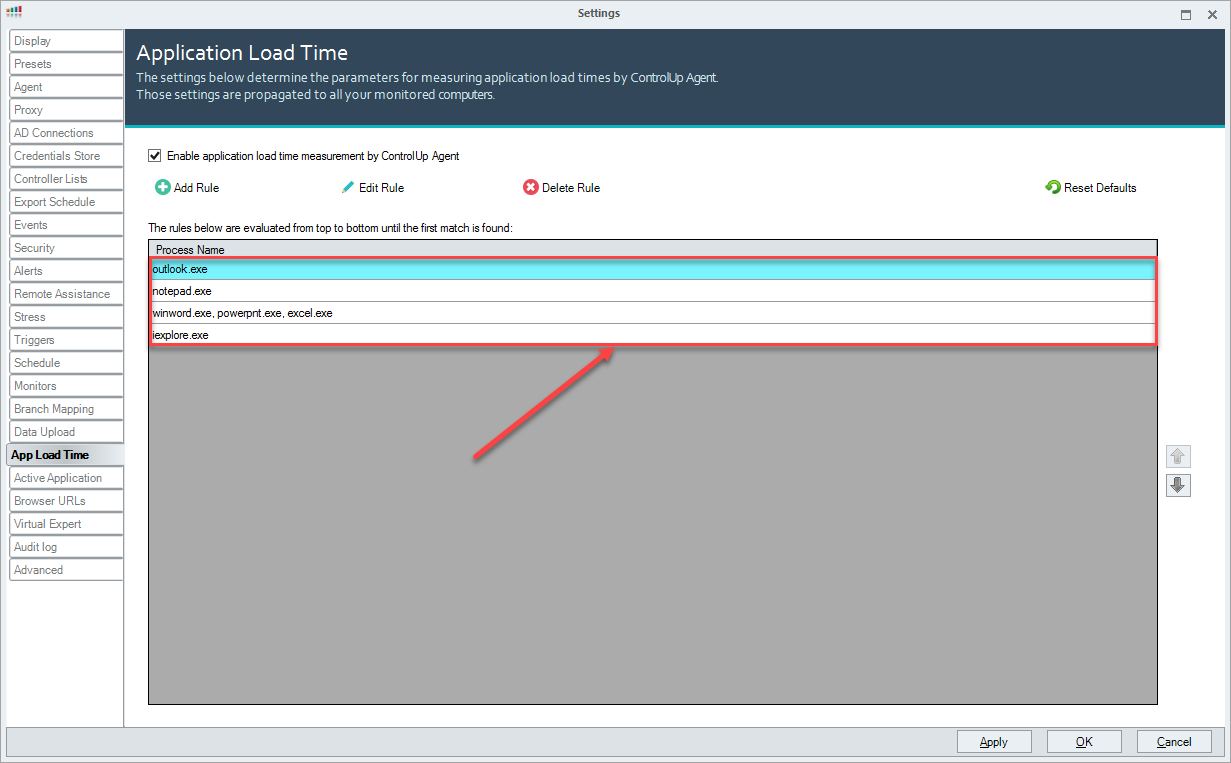
-
On the machine(s) you want to monitor the Application Load Time
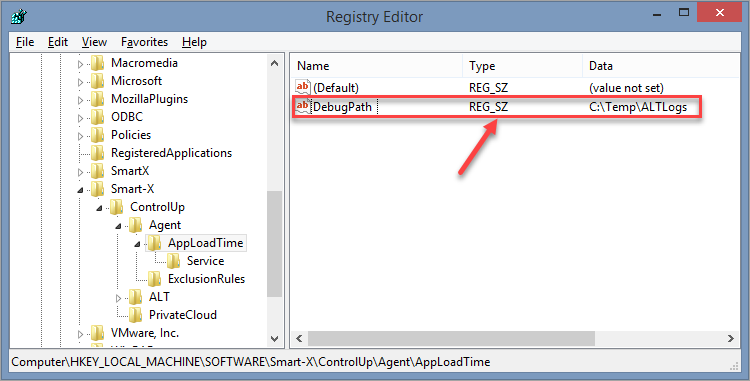
a. Open the registry with regedit.exe
b. Navigate to the registry keyHKEY_LOCAL_MACHINE\SOFTWARE\Smart-X\ControlUp\Agent\AppLoadTime
c. Create a new REG_SZ (String) valueDebugPath
d. As the value, set the path of the folder you want to store the debug logs:
-
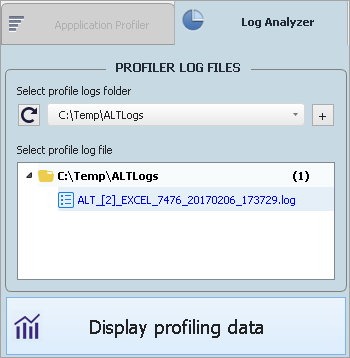
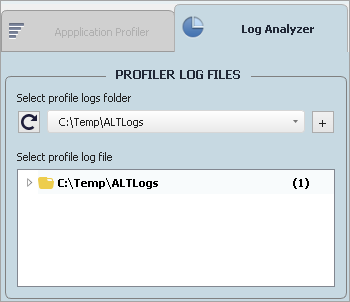
Open the Application Load Time Profiler
a. Open the Log Analyzer tab
b. Click + to add the folder where your logs are saved
c. Choose the log you wish to analyze and click Display profiling data