Now that you have created your ControlUp organization, read this article to learn about ControlUp products and how to get started.
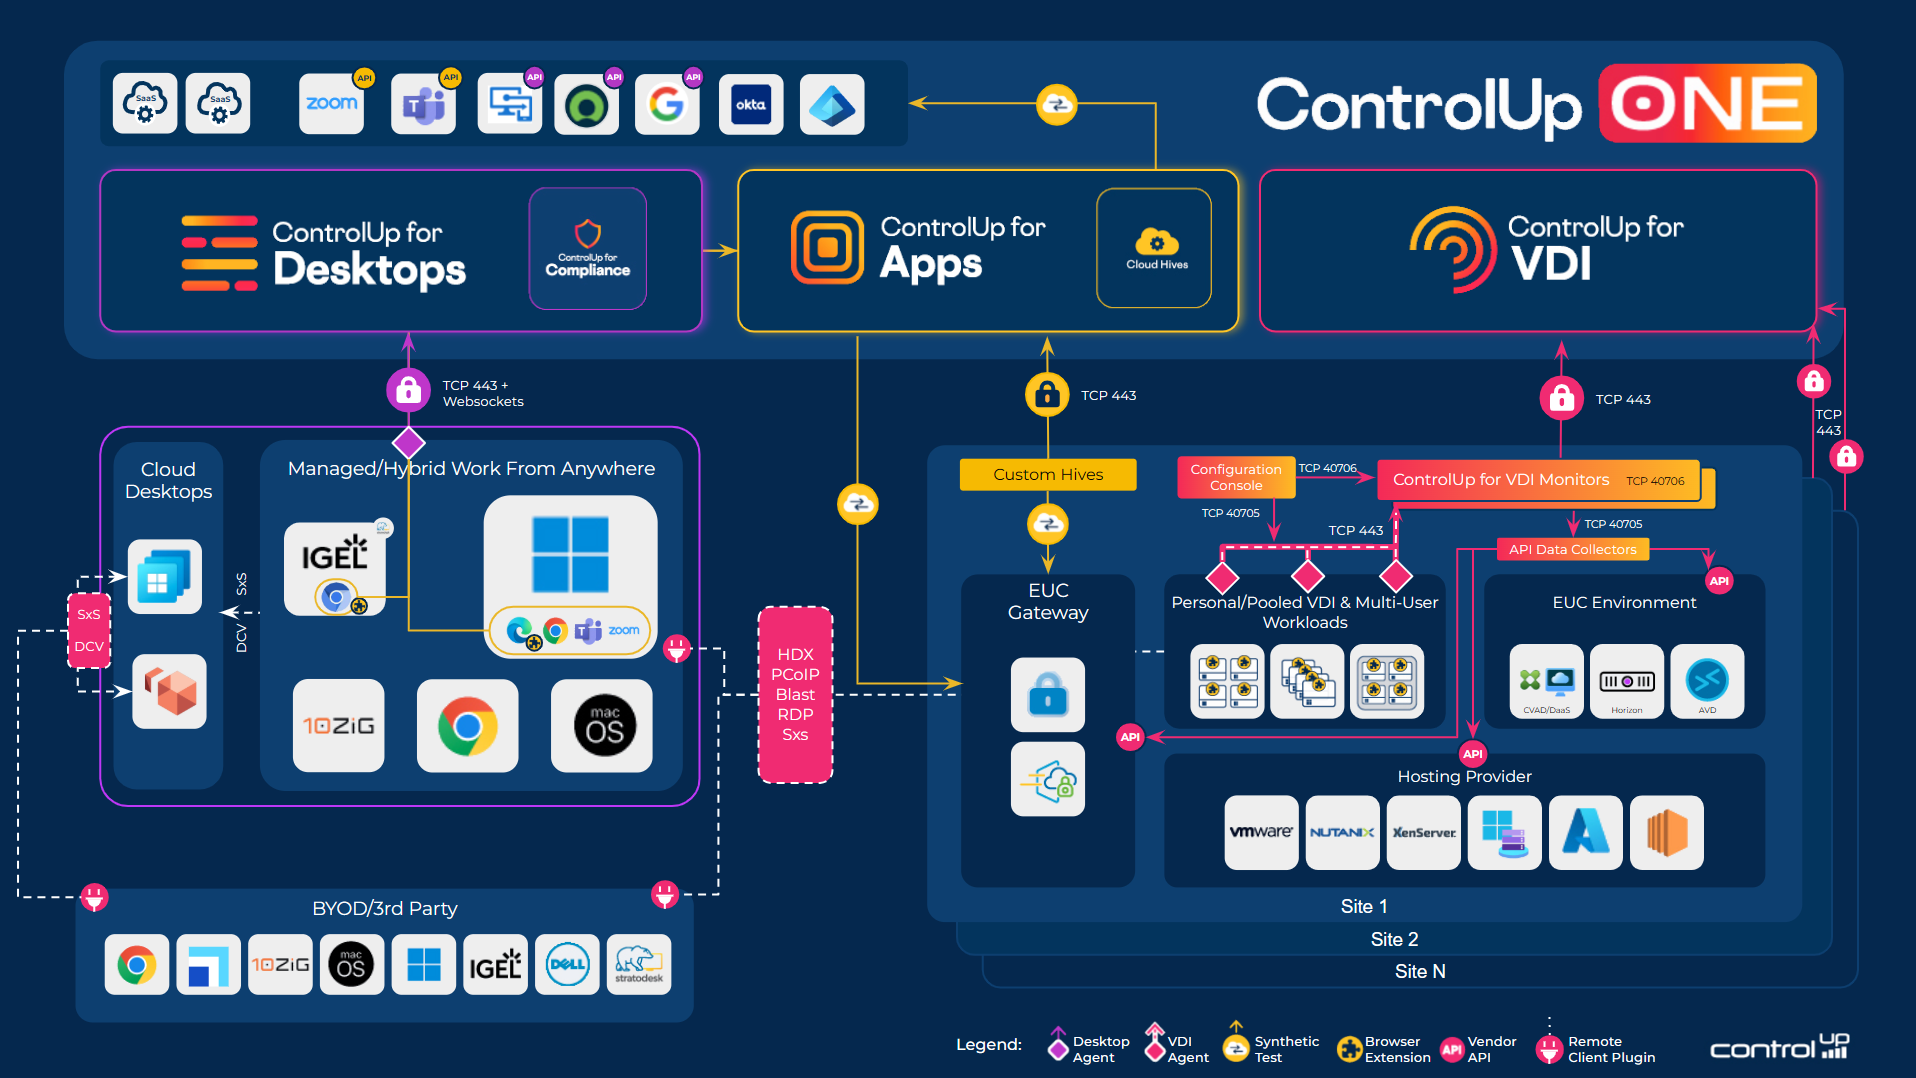
ControlUp ONE Architecture
Before the installation, you should be familiar with the different components and their functionalities. Read below for more details on the components and how to install them.
ControlUp Apps Overview
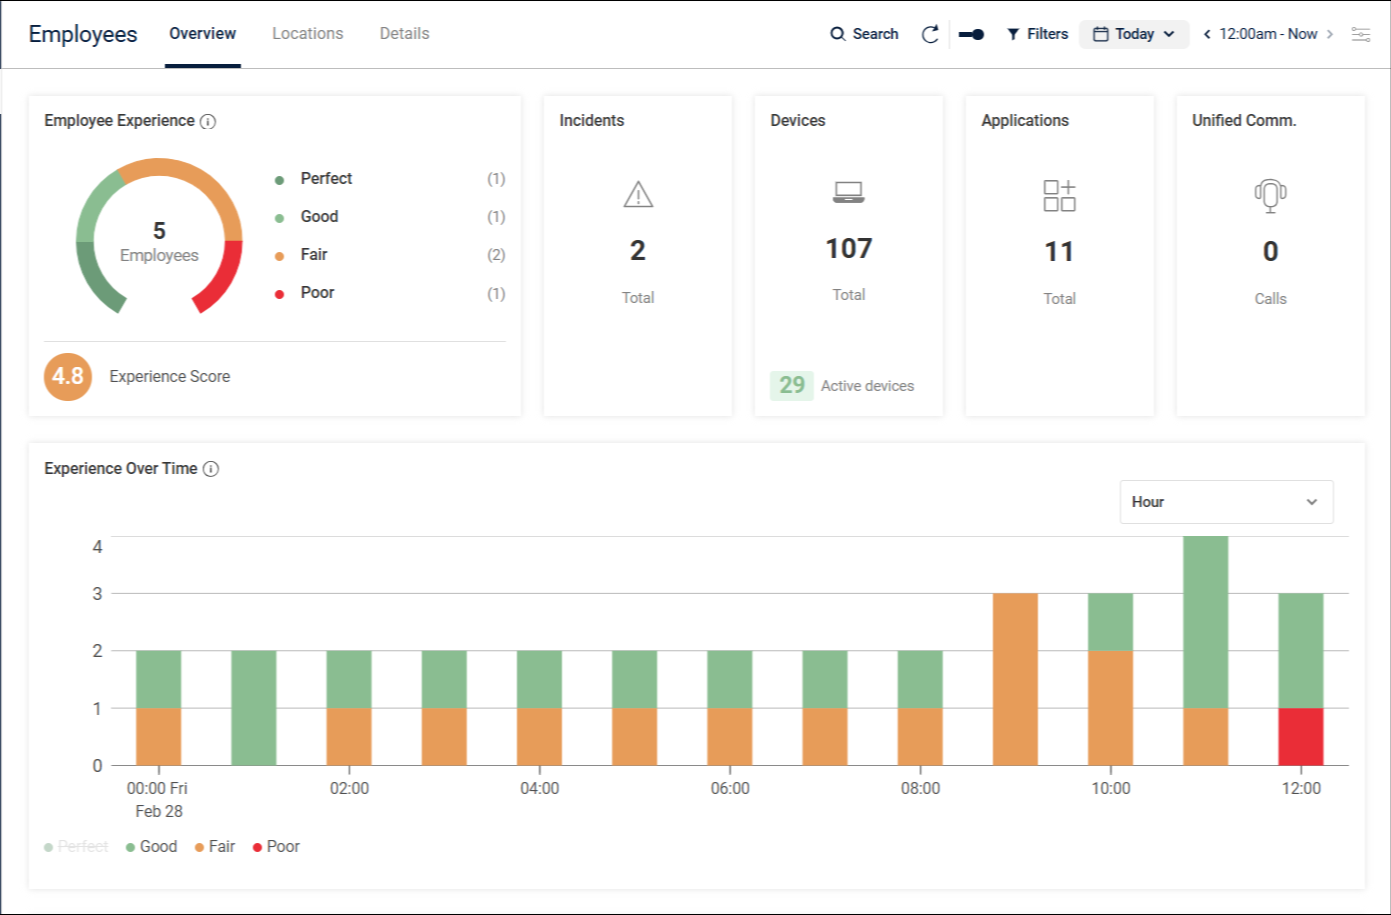
Employees
The Employees page lets you monitor the activity and the digital experience quality of your organization’s employees as a whole, as well as individual employees.
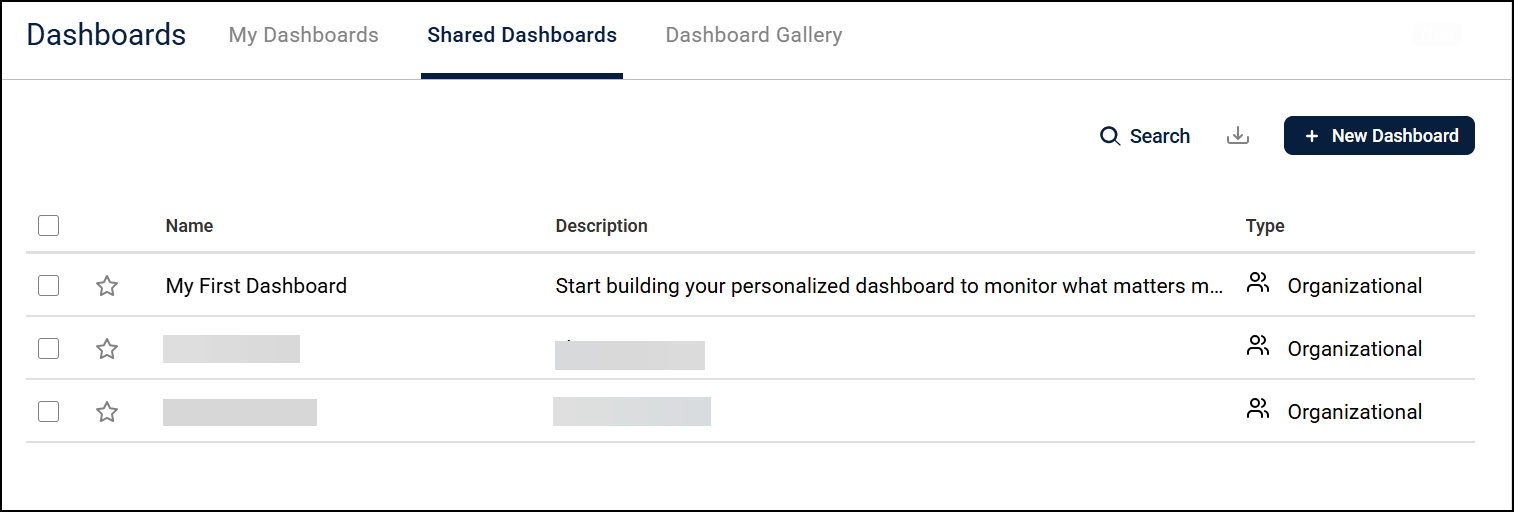
ControlUp Dashboards
The Dashboards page lets you create your own dashboards, to monitor the key metrics that are most important to your organization, using customizable widgets and visualizations.
ControlUp for Desktops
Use the Devices page to monitor and manage your physical endpoints. See detailed live metrics and historical insights, create automations with your own scripts, launch remote control/shadow sessions, and more. 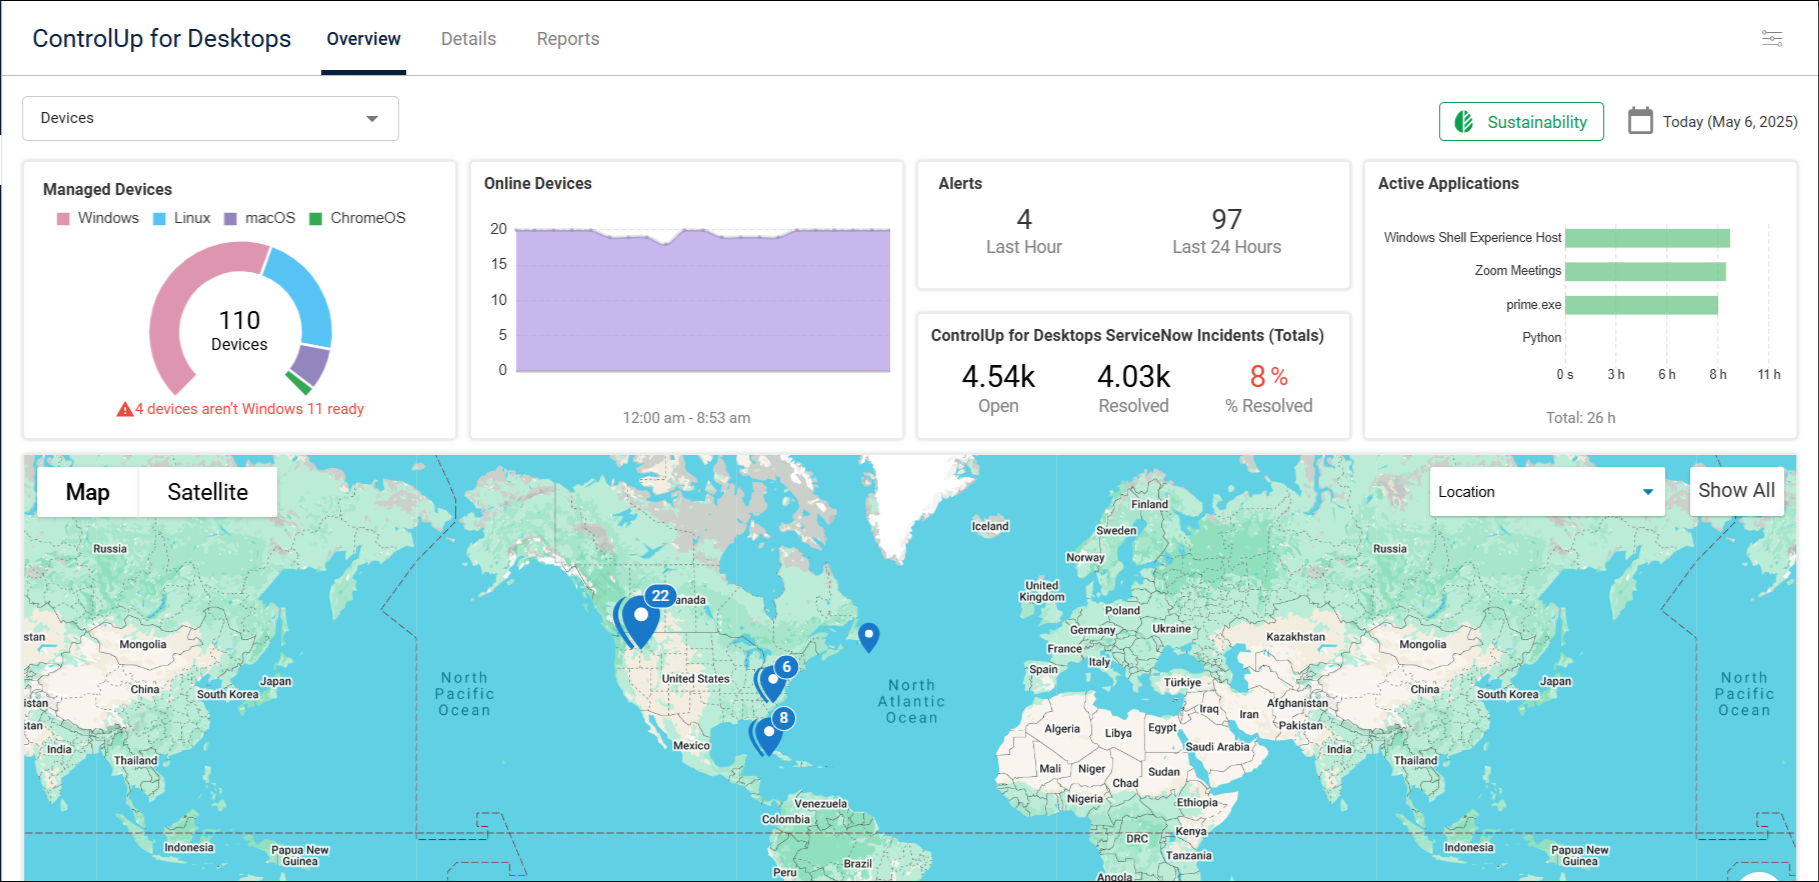
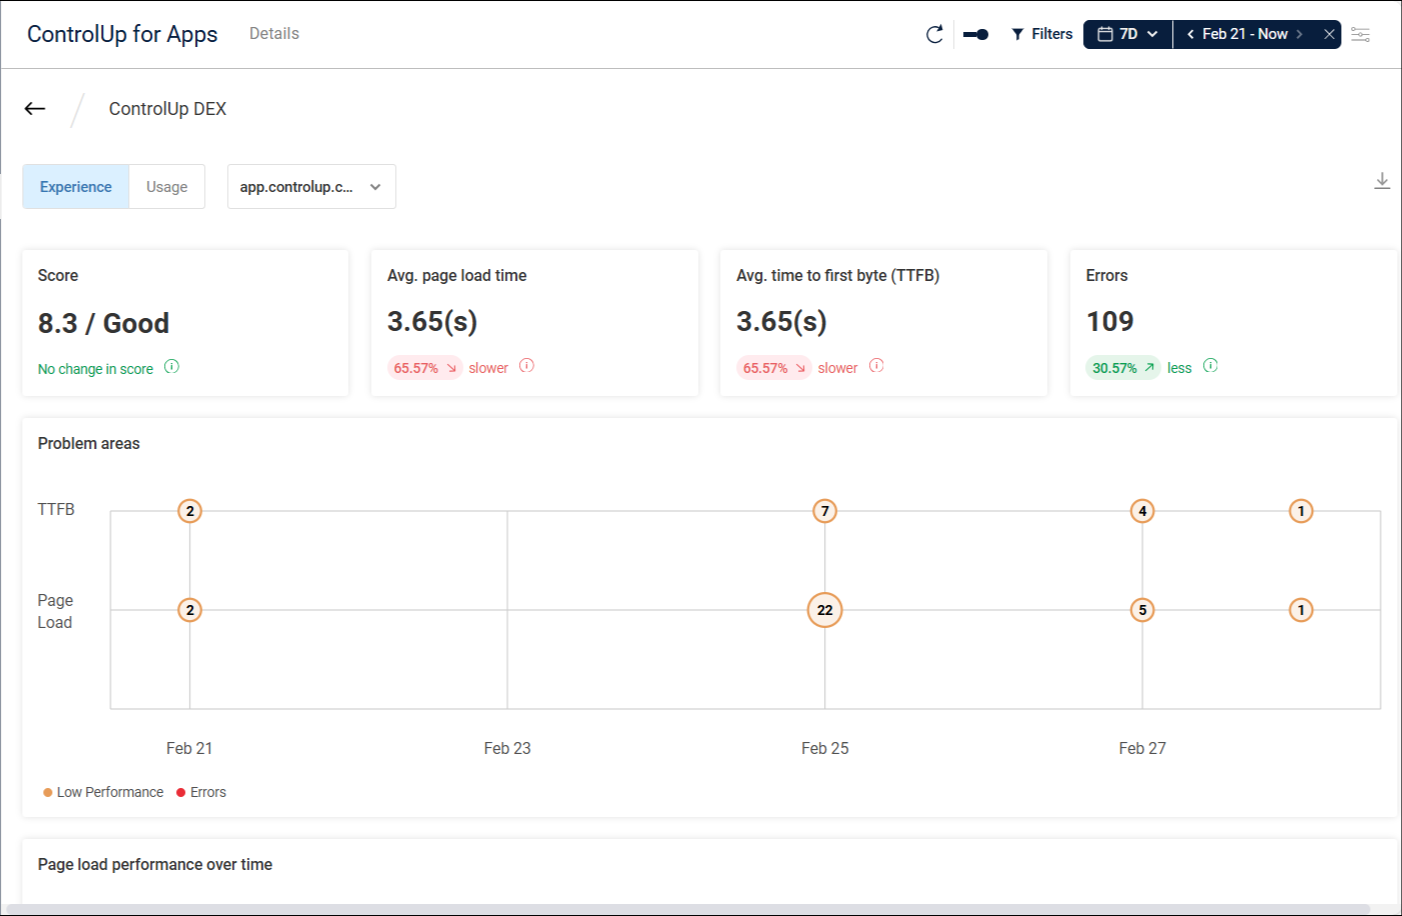
ControlUp for Apps
Use the Applications page to monitor the performance and availability of SaaS and web applications based on real user data.
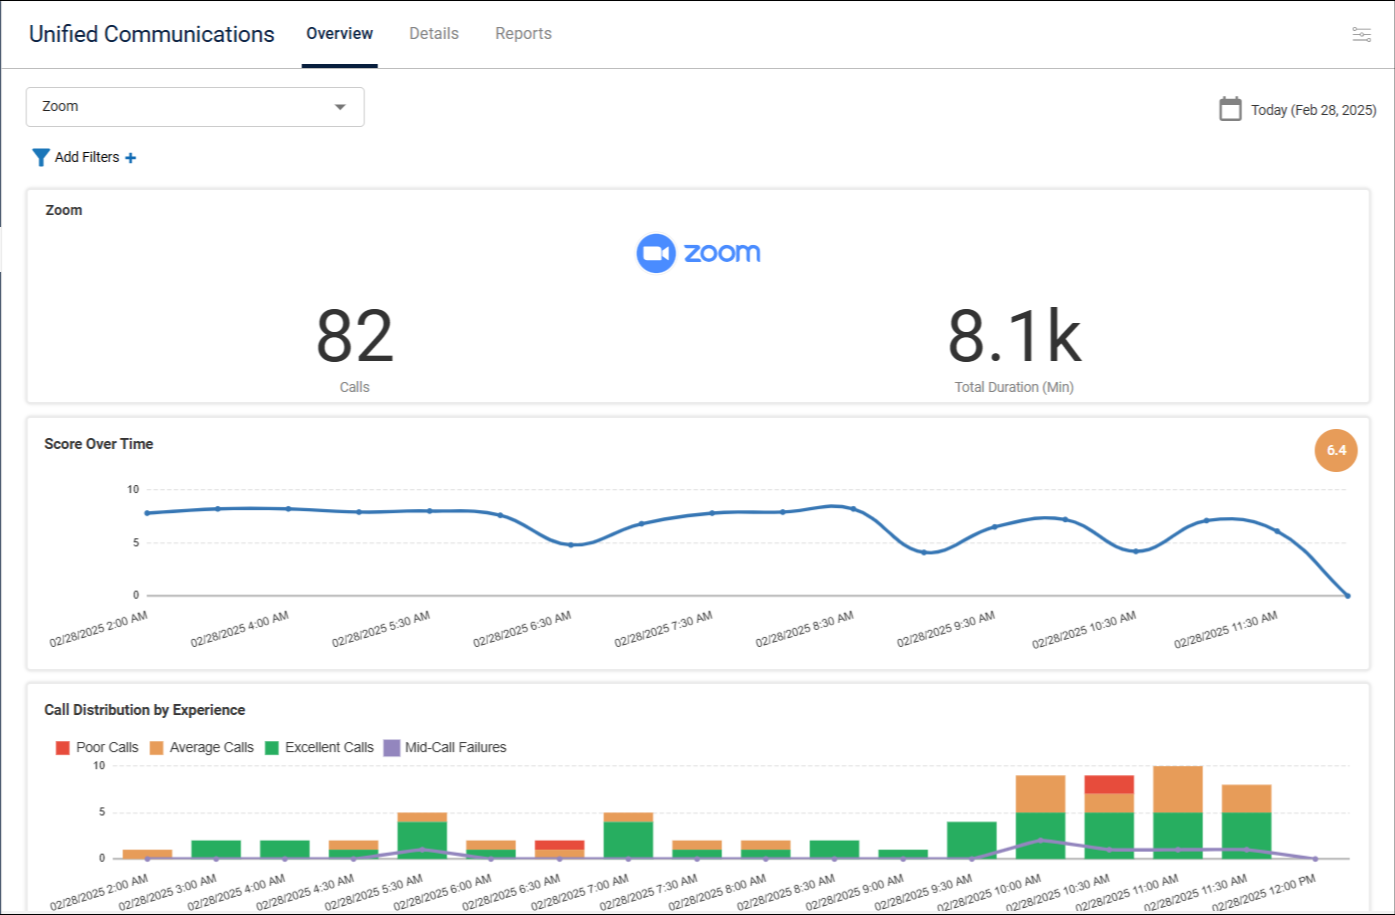
Unified Communications (UC&C)
Use the UC&C page to monitor Microsoft Teams and Zoom call quality and experience.
Employee Sentiment
Use the Employee Sentiment page to create and deliver custom surveys.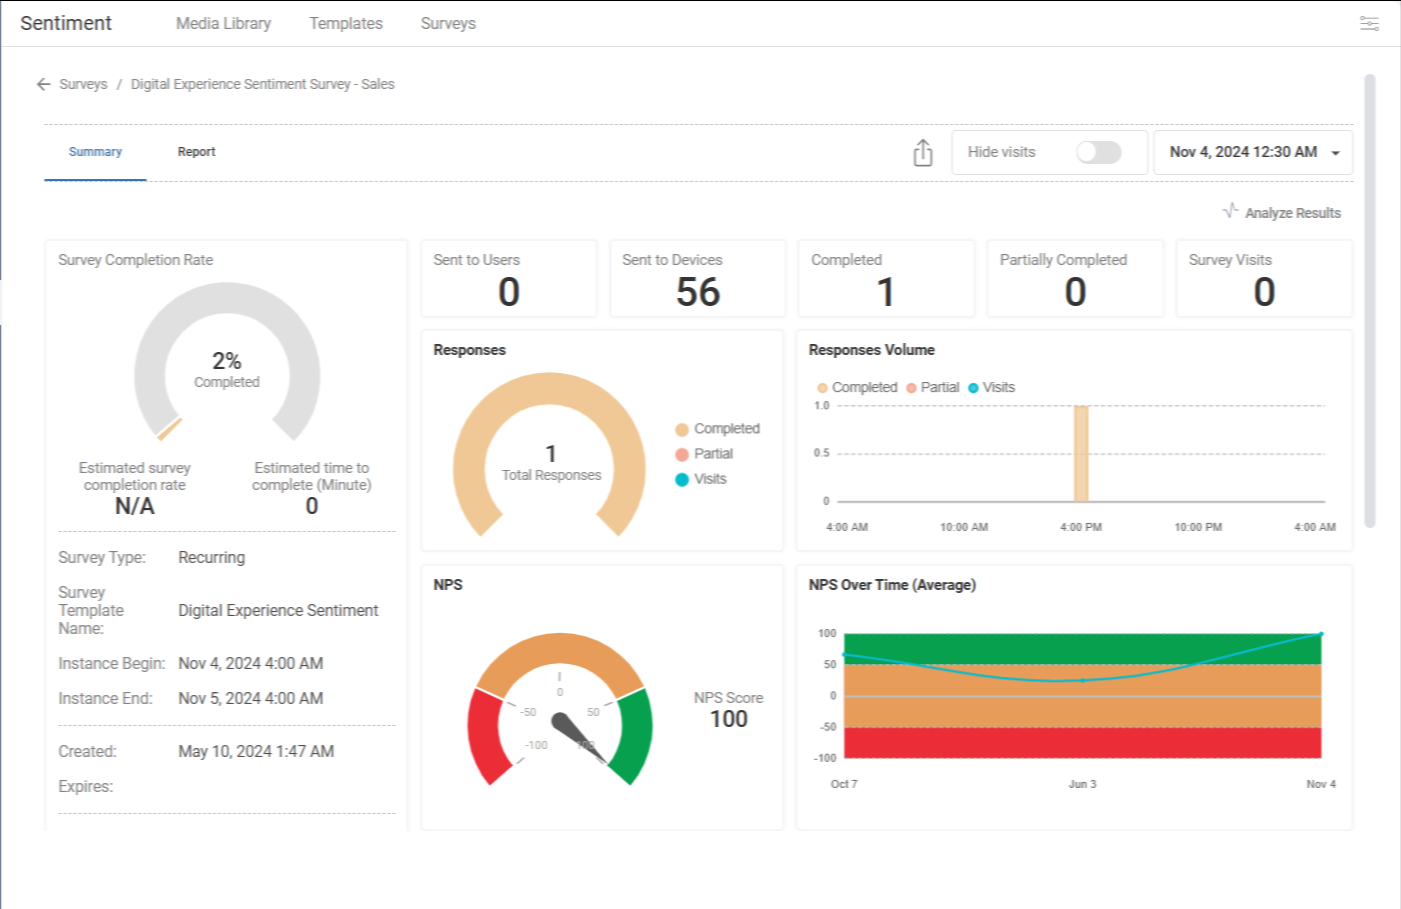
ControlUp for VDI
Use the VDI page to monitor and manage your virtual infrastructure in real-time.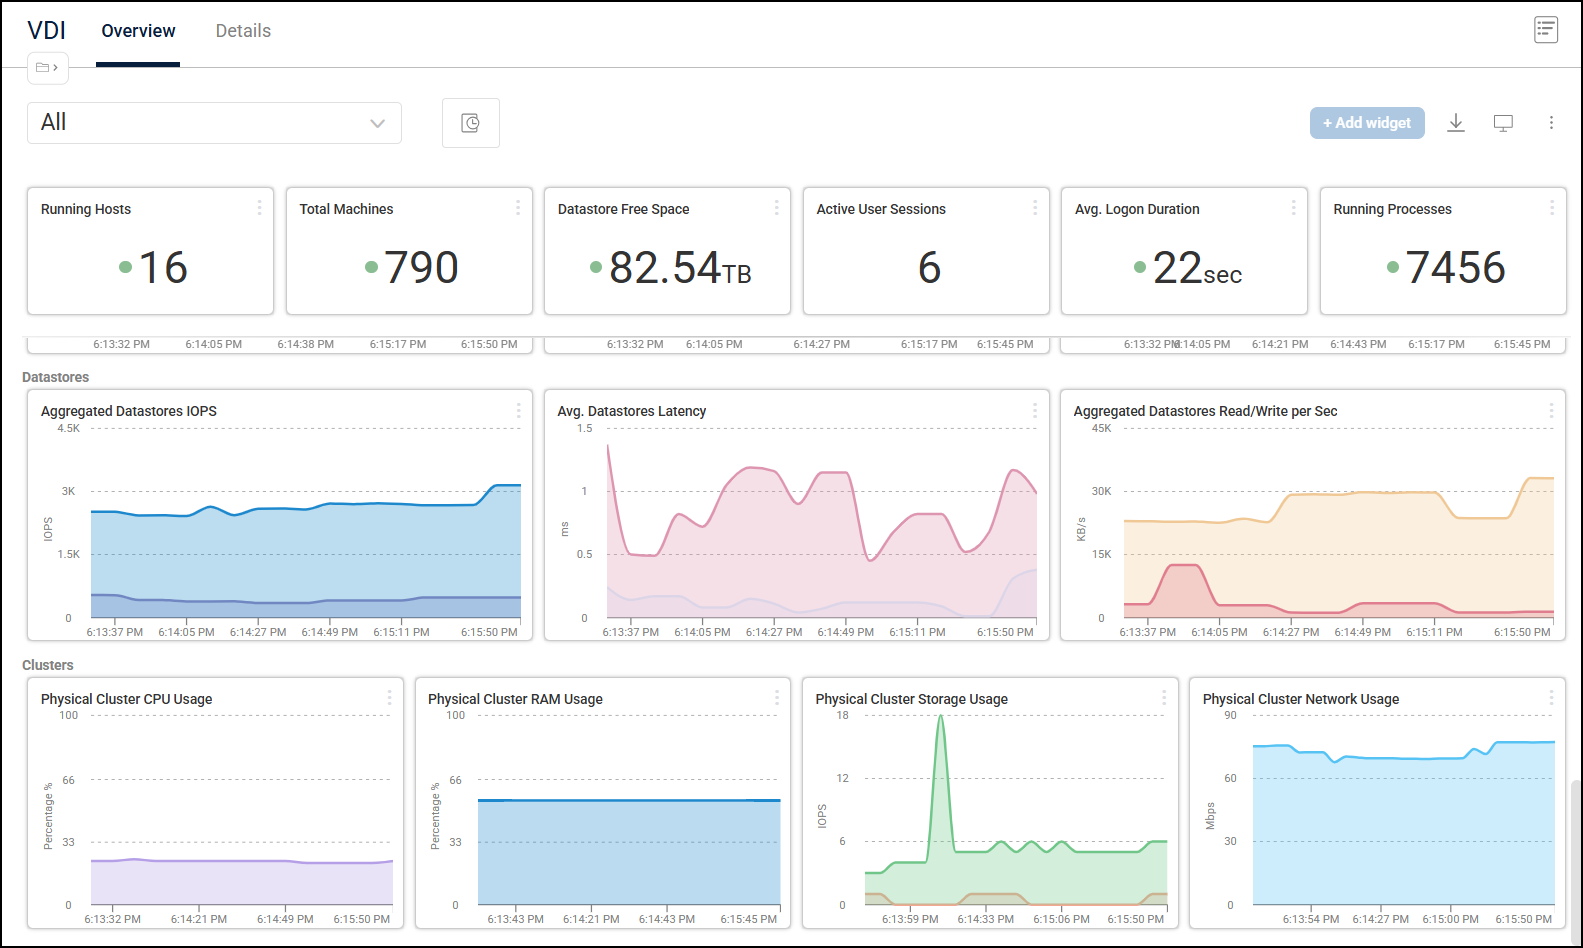
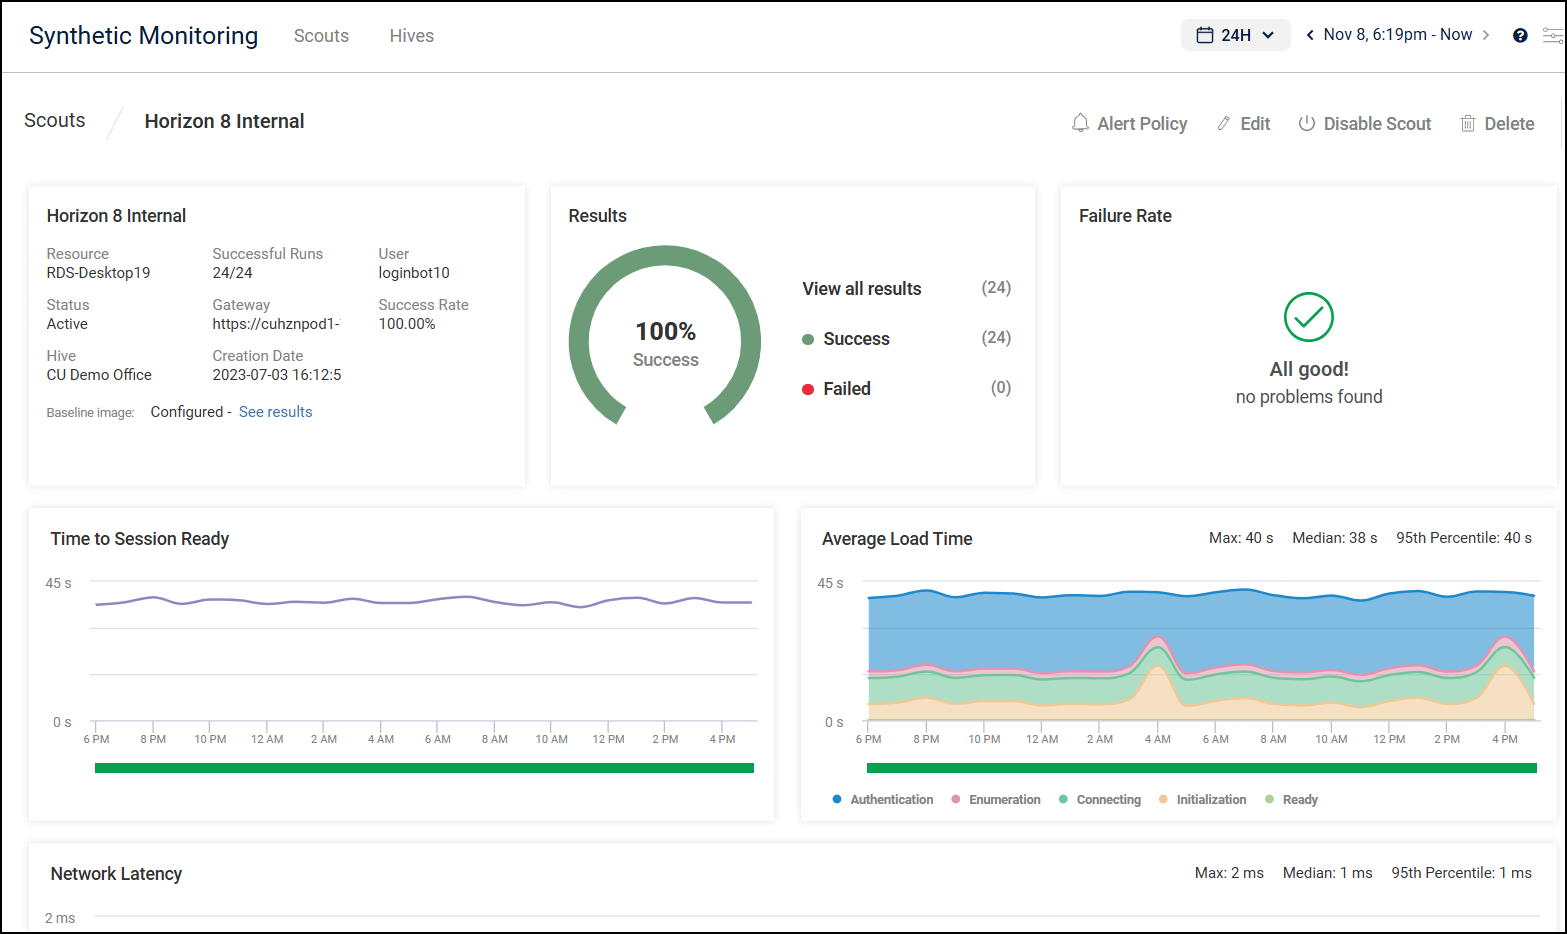
Synthetic Monitoring
Use the Synthetic Monitoring page to proactively test critical resources and receive alerts when something goes wrong.
ControlUp for Compliance
Use the Compliance page (formerly Secure DX) to improve physical endpoint security by identifying and remediating security issues.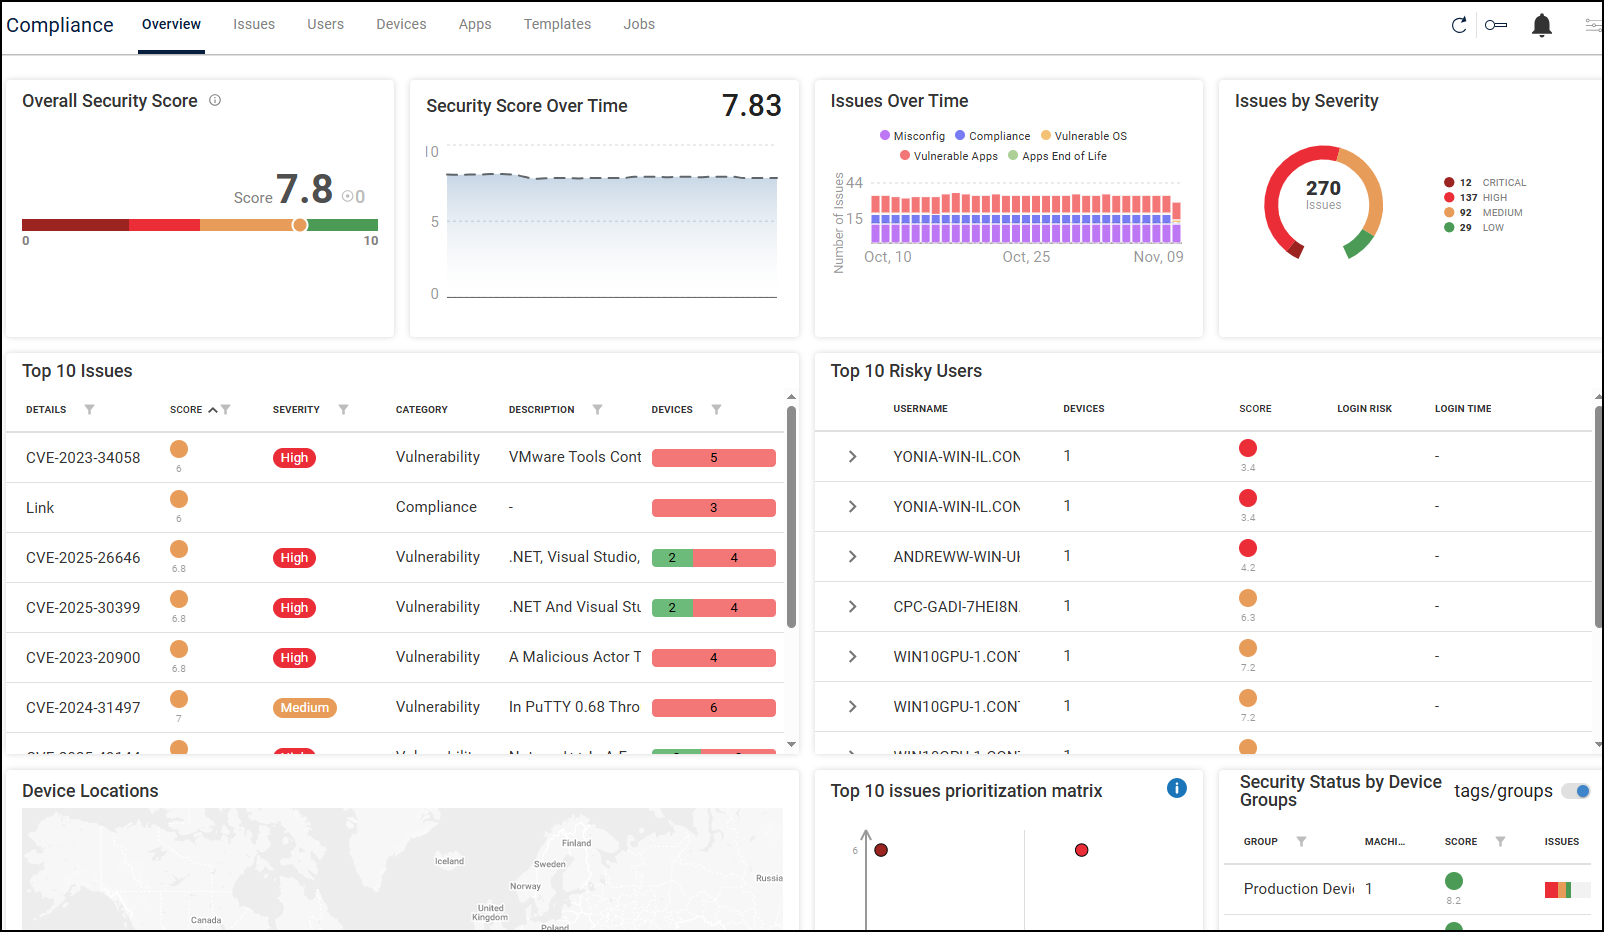
ControlUp Workflows
Use the Workflows page to visually streamline, automate, and integrate your operational tasks.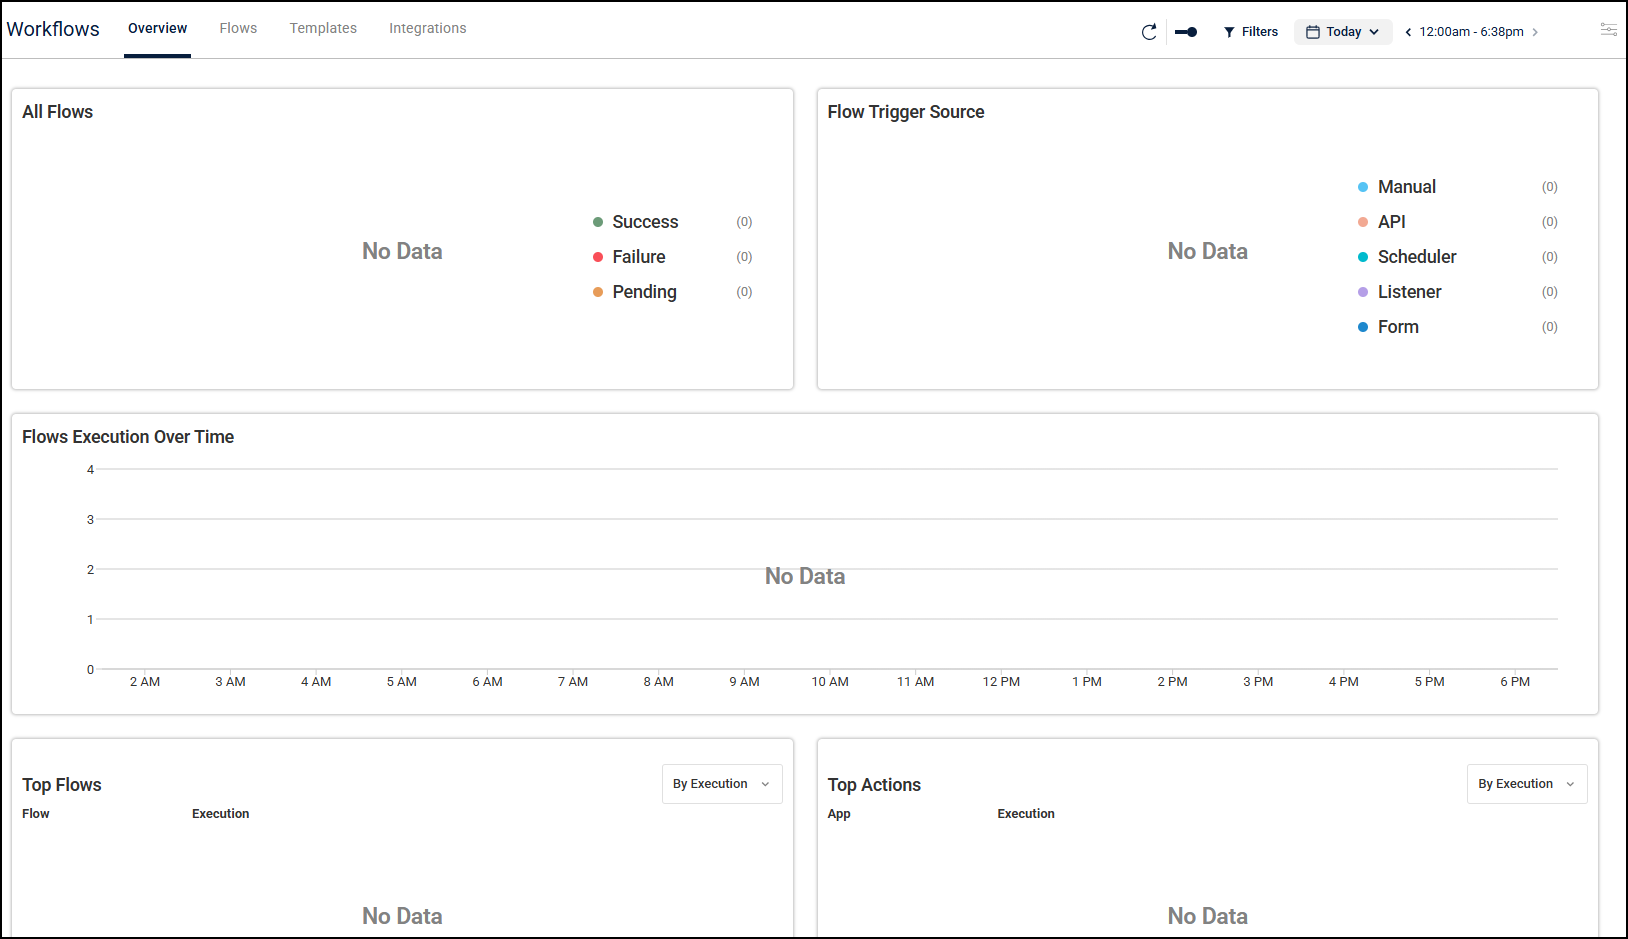
Reports
Use the Reports for historical analytics of your VDI & DaaS environment, and cost-saving insights.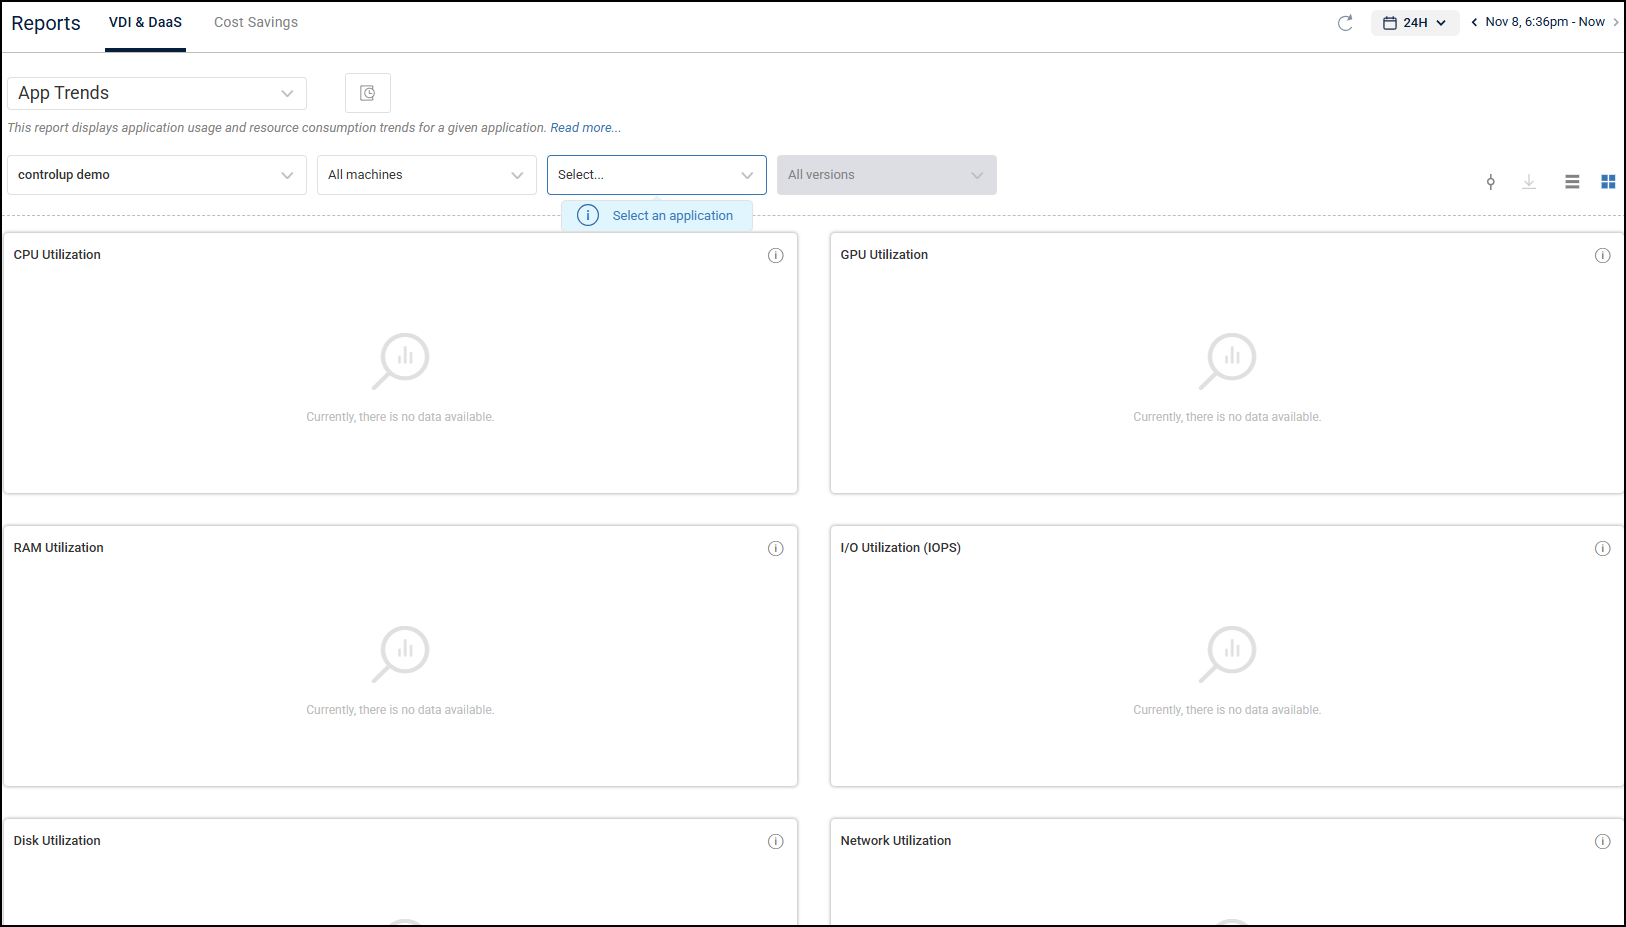
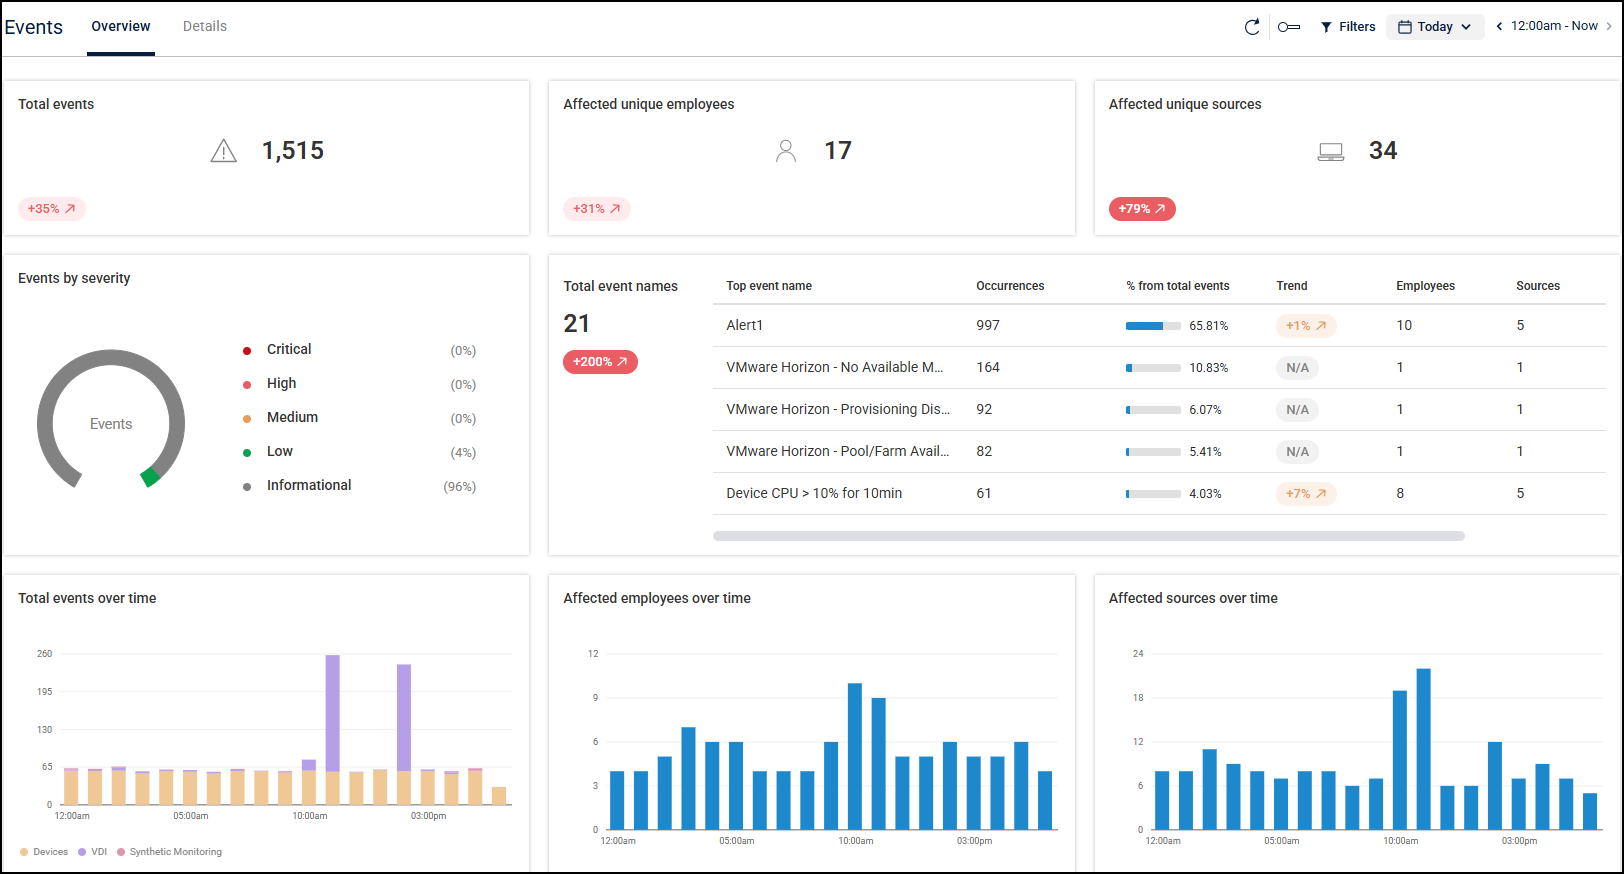
Events Management
The DEX Events platform is a single, consolidated view of all DEX events across your ControlUp environment, providing an actionable event timeline.
How to Get Started
Depending on whether you are using ControlUp for Desktops or ControlUp for VDI, read the following articles to learn how to get started: