Feature available only in version 9.2.5
This article describes monitor features only available in ControlUp Real-Time DX version 9.2.5.
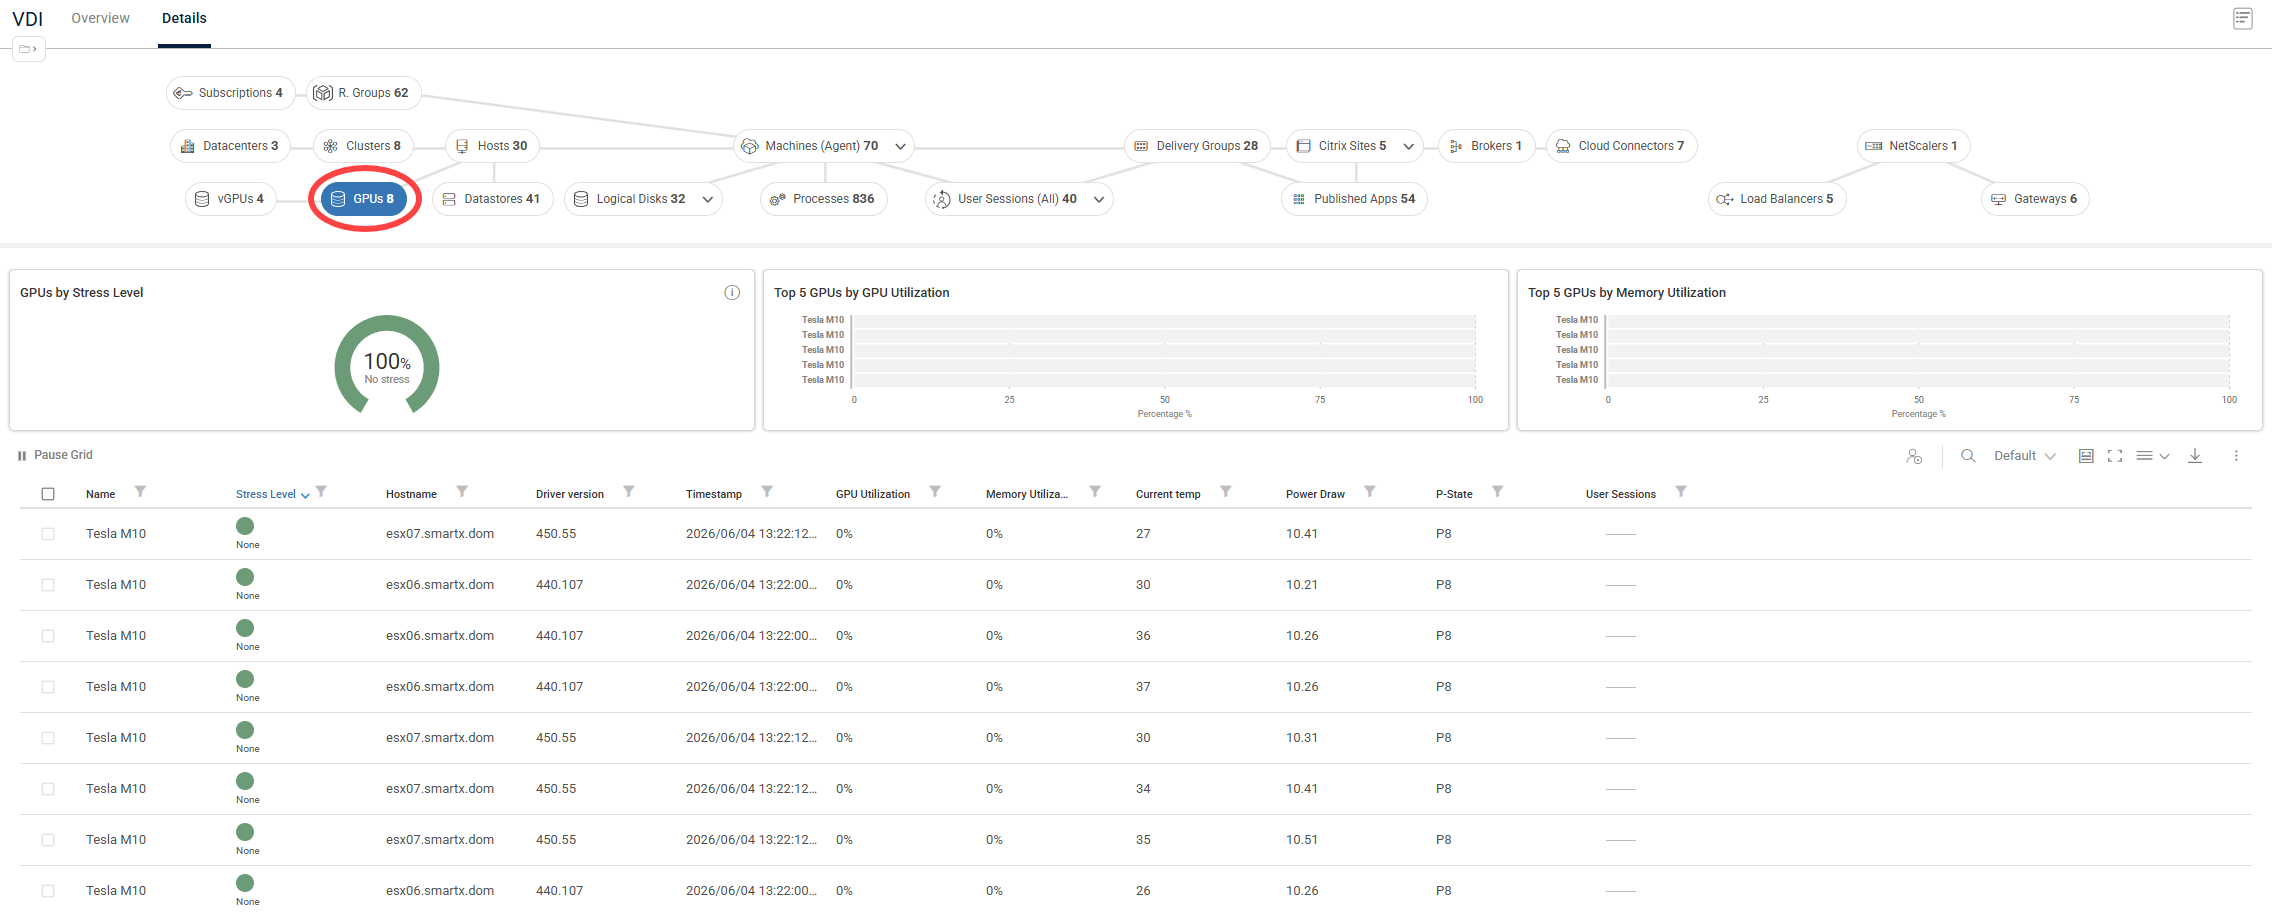
The GPUs view provides comprehensive, host-level monitoring for physical NVIDIA GPUs. This view in the Real-Time DX Console and the VDI web UI gives you deep visibility into hardware performance, resource consumption, and environmental metrics, helping you right-size infrastructure capacity and control costs.
GPU metrics are displayed across the real-time topology, appearing in the dedicated GPUs view widgets and data grid, as well as in new GPU metrics columns on the existing Hosts and Machines views grids. You can focus on a specific host or machine in the topology view (Details) or organization tree, and drill down directly to individual user sessions utilizing GPU resources.
You can also use GPUs to configure Stress, Scheduled, and Advanced triggers, as well as Script-based Actions, to help your organization get ahead of rising GPU costs.
Note
Because NVIDIA doesn’t expose GPU metrics through standard VMware APIs, host-level data collection for this feature requires direct SSH access to your ESXi hosts.
GPU Triggers and Actions
GPUs are fully integrated targets within ControlUp for VDI's automation engine, empowering you to move from passive monitoring to proactive management.
Stress Settings & Alerting
You can configure customized stress level thresholds for GPU metrics like utilization, memory depletion, or high temperatures. When a host's GPU exceeds these health parameters, its color-coded stress state shifts in real-time, alerting you to potential bottlenecks before end-user experience degrades.
Advanced & Scheduled Triggers
Set up automated workflows using Advanced Triggers. For example, to manage cost control: Schedule reports or trigger alerts on underutilized GPU assets to optimize allocation across your host clusters.
Script-Based Actions (SBAs)
Contextual SBAs can be executed directly against objects in the GPUs view. You can run diagnostics, gather deeper NVIDIA SMI log telemetry, or reset stuck display sub-systems right from the grid without opening a separate host management shell.
GPUs View Column Reference
The following columns are available in the Information Grid while using the GPUs view.
Column | Description |
|---|---|
Name | Name/model of the GPU |
Hostname | The name of the host which hosts GPUs |
Driver version | Installed NVIDIA driver version |
Timestamp | The timestamp of when the query was made |
GPU Utilization | Percentage of GPU core usage |
Memory Utilization | Percentage of memory bandwidth usage |
Current temp | Current temperature of the GPU |
Power Draw | Real-time power consumption |
P-State | Power state (performance level), e.g., P0 = max performance, P8 = idle |
User sessions | Total number of user sessions on virtual machines using this GPU |
Active vGPUs | Number of active virtual GPUs (vGPUs) currently running on the physical GPU |
Bus Id | PCI bus ID of the GPU |
Clocks - graphics | Current graphics clock speed |
Clocks - SM | Current Streaming Multiprocessor clock speed |
Clocks - Video | Current video encoder/decoder clock speed |
Clocks Memory | Current memory clock speed |
Free memory | Free (unused) GPU memory |
Index | GPU identifier on the host (e.g., 0, 1, 2, 3) |
Installed memory | Total GPU memory available |
Max operating temp | Maximum safe operating temperature defined by the GPU manufacturer |
Power limit | Maximum power draw allowed |
Scheduler policy | vGPU scheduler policy configured on the physical GPU (e.g., Equal Share, Best Effort) |
Shutdown temp | The critical temperature at which the GPU will automatically shut down to prevent hardware damage |
Slowdown temp | The temperature at which the GPU begins to throttle performance to prevent overheating |
Stress Level | Stress Level is a flexible load measure which you can customize using the "Stress Settings" pane |
Target Temperature | Target temperature the GPU attempts to maintain under load by adjusting cooling mechanisms such as fan speed |
Used memory | Currently used GPU memory |
UUID | Universally unique identifier of the GPU |