To see performance and availability data for an application, go to the Details tab, click on an app group, and select the Experience tab.
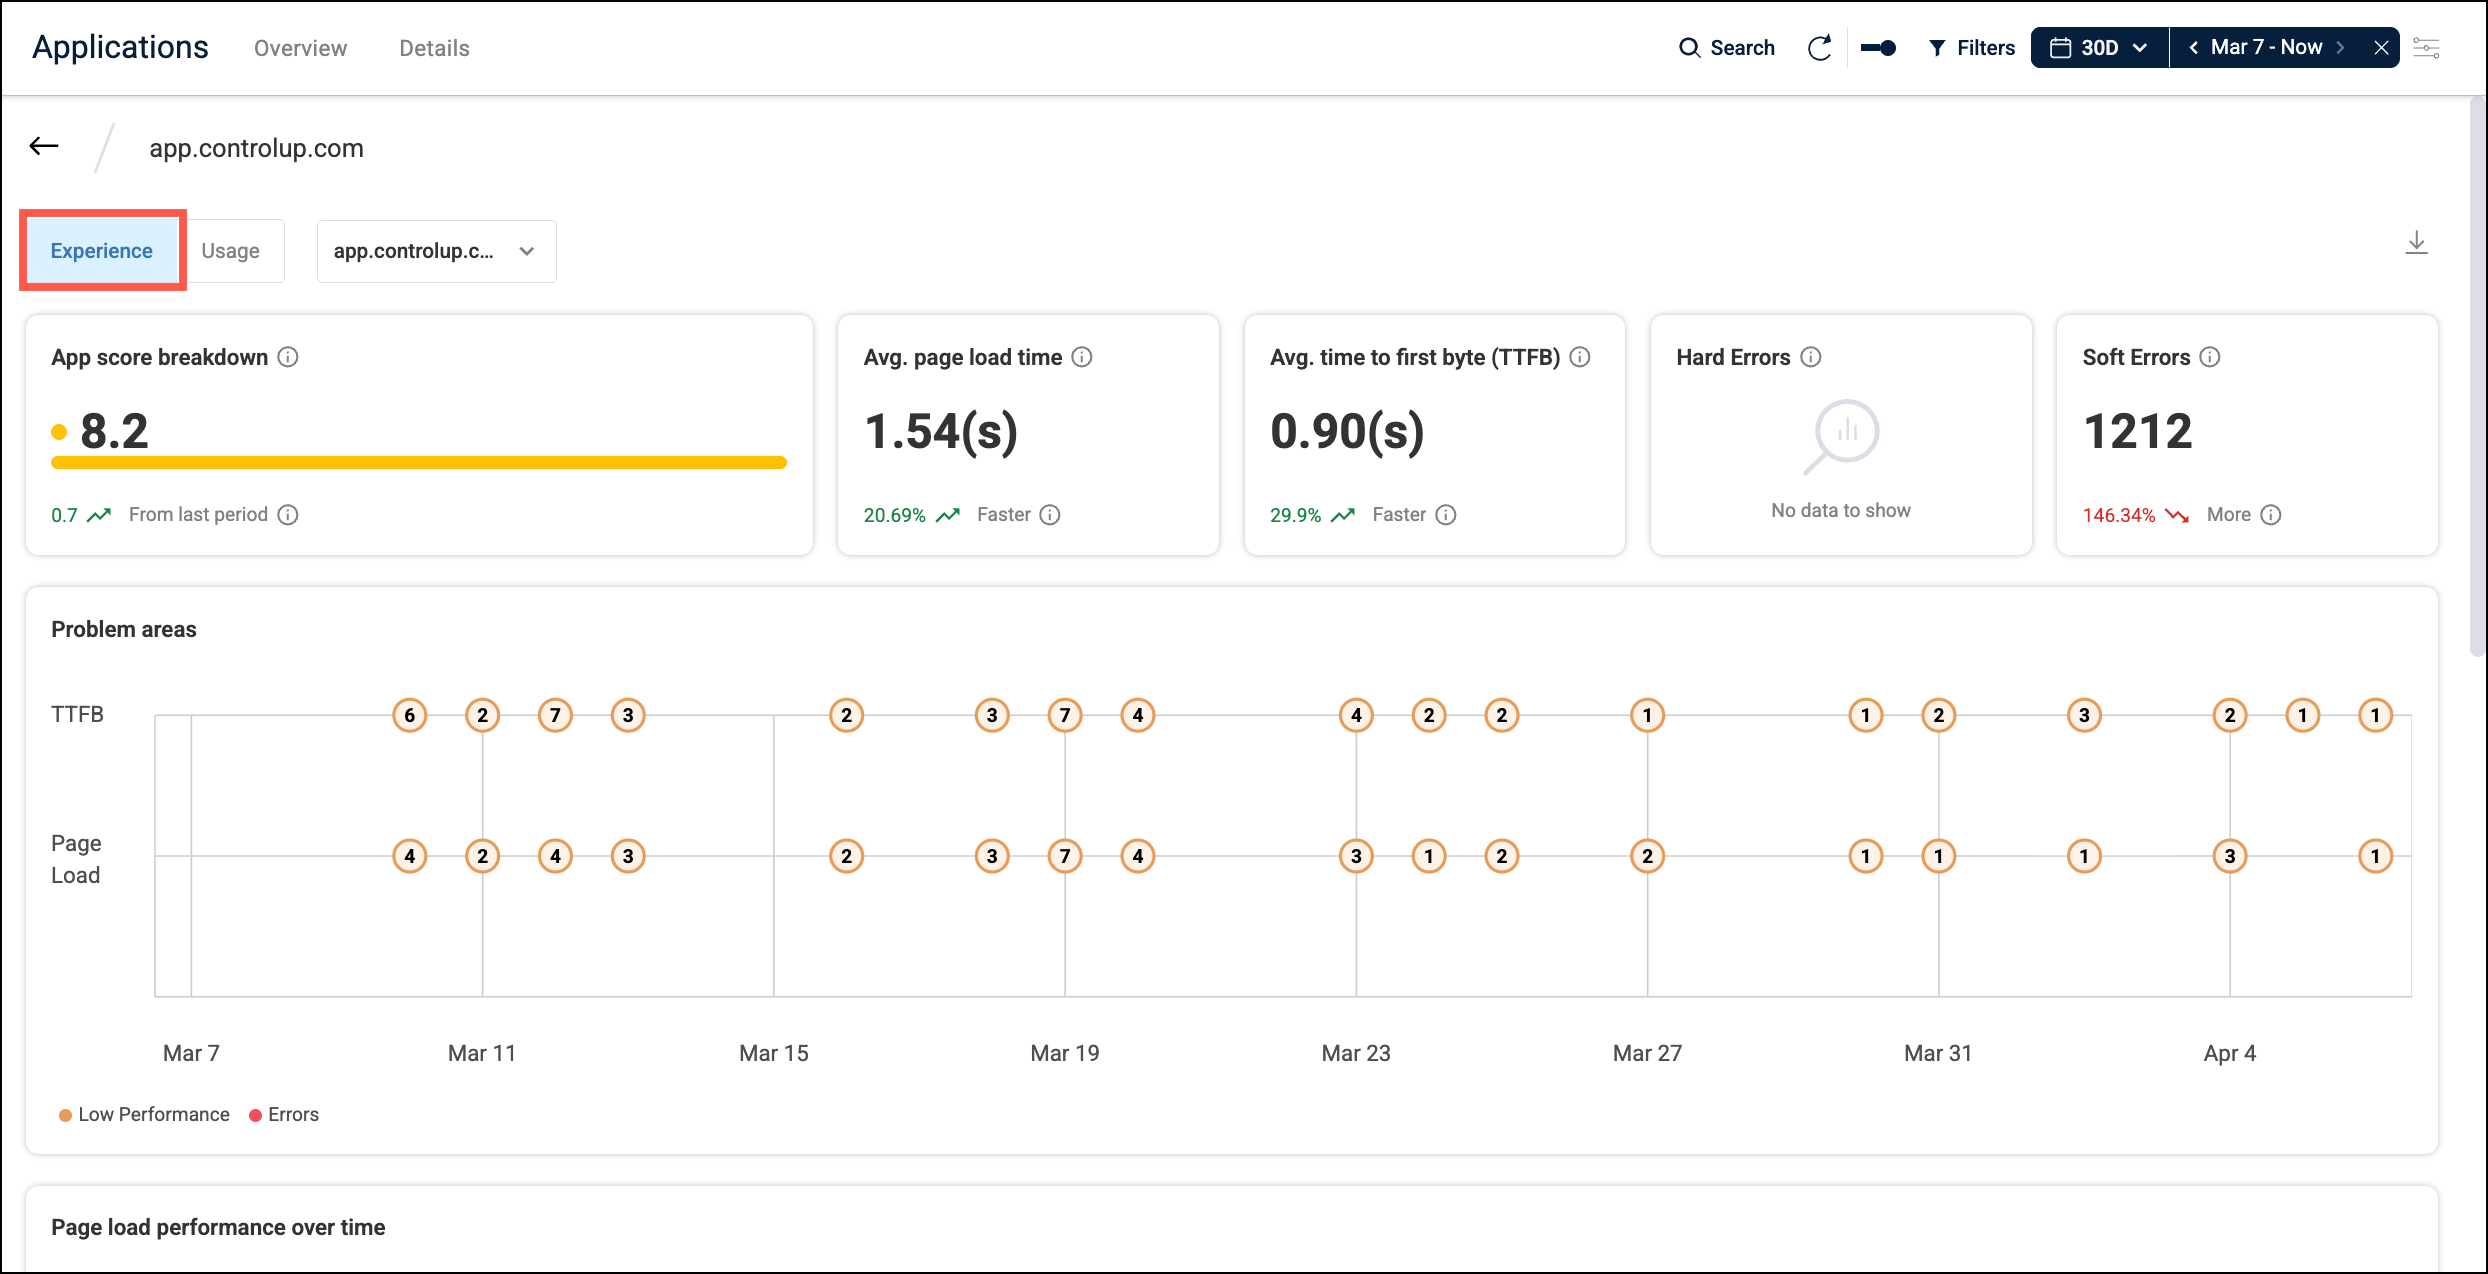
By default, the page displays data from all URLs in the app group. If you want to view data only for a specific URL, use the dropdown at the top of the page.
Top Row Widgets
The row of widgets at the top of the page displays a summary of the application's performance during the selected time period, including:
- App score breakdown - Average app score across all users. If your app group has multiple domains, you can hover over the score bar to see the score per domain. The score is calculated based on the number of visits with an incident. Click here to learn more about incidents.
- Avg. page load time - Average time for the page to fully load.
- Avg. time to first byte (TTFB) - Average time until the first byte of the response is received.
- Hard Errors and Soft Errors - Number of hard and soft errors. Learn more about error types.
Each of these widgets also displays how the metric compares to a previous time period so you can see if the application performance is getting better or worse. The time period used for comparison depends on the time period you have selected at the top of the page. You can hover over the tooltip to see the exact dates used for the comparison.

- If the duration of your selected time period is between 1 hour and 1 week (inclusive), then the metrics are compared with data from the same duration in the previous week. For example, if your selected time period is from Monday Feb 17th to Wednesday Feb 19th, then the metrics are compared with data from Monday Feb 10th to Wednesday Feb 13th.
- If the duration of your selected time period is less than 1 hour or greater than 1 week, then the metrics are compared with data from the same duration immediately before the selected time period. For example, if your selected time period is from 2:00 PM to 2:30 PM, then the metrics are compared with data from 1:30 PM to 2:00 PM.
Problem Areas
The Problem areas widget displays all incidents reported over the selected time period. Click here to learn more about incidents.
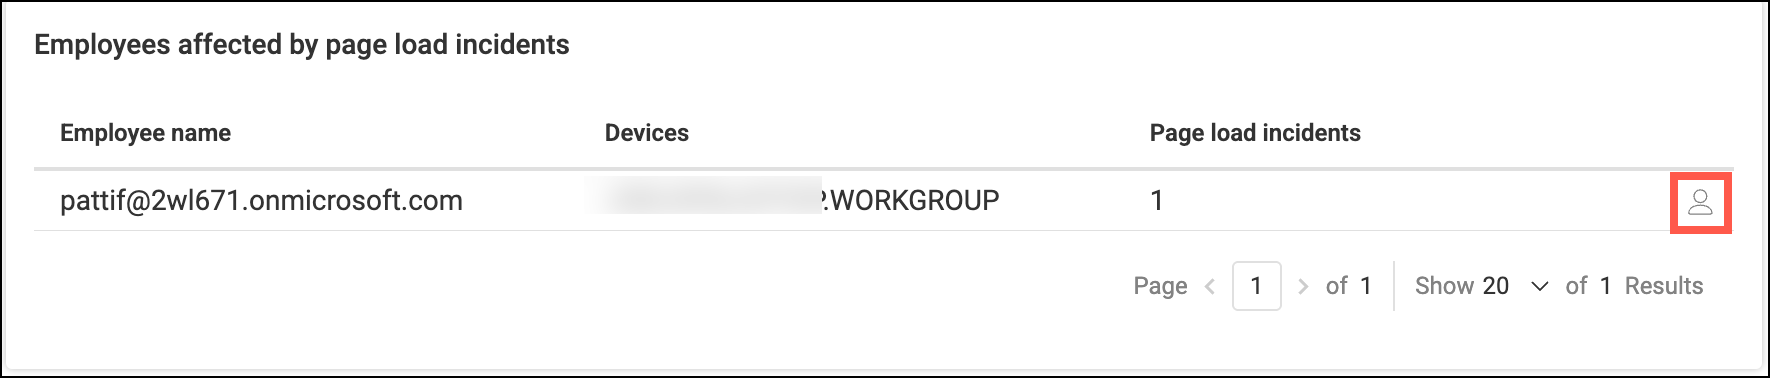
Click on an incident in the Problem areas widget to see detailed metrics around the time of the incident, and to see which employees and devices were affected.
From the list of affected employees, you can click on an employee to see detailed device and browser metrics. This drilldown displays the minimum, maximum, and average values for metrics for each time the incident occurred within the selected time period. For example, you might find that the average memory utilization was very high for each incident, and that the incident didn't occur when the memory utilization was low. This indicates that memory is likely to be causing the issue. On the other hand, you might find that the average memory utilization was very high, but the incident also occurred when the memory utilization was low. This indicates that memory is unlikely to be causing the issue.
You can click on the employee icon to drilldown into the Employees dashboards. The time period in the Employees dashboards is automatically set, so you can see more user activity data around the time of the incident.
On the Experience over time chart on the Employees dashboards, you can expand the Applications row and click on an application with incidents to see more details about the user's interaction with the application. If the user experienced a Hard Error, you can select the checkbox to see a screenshot to help you troubleshoot the cause of the error.
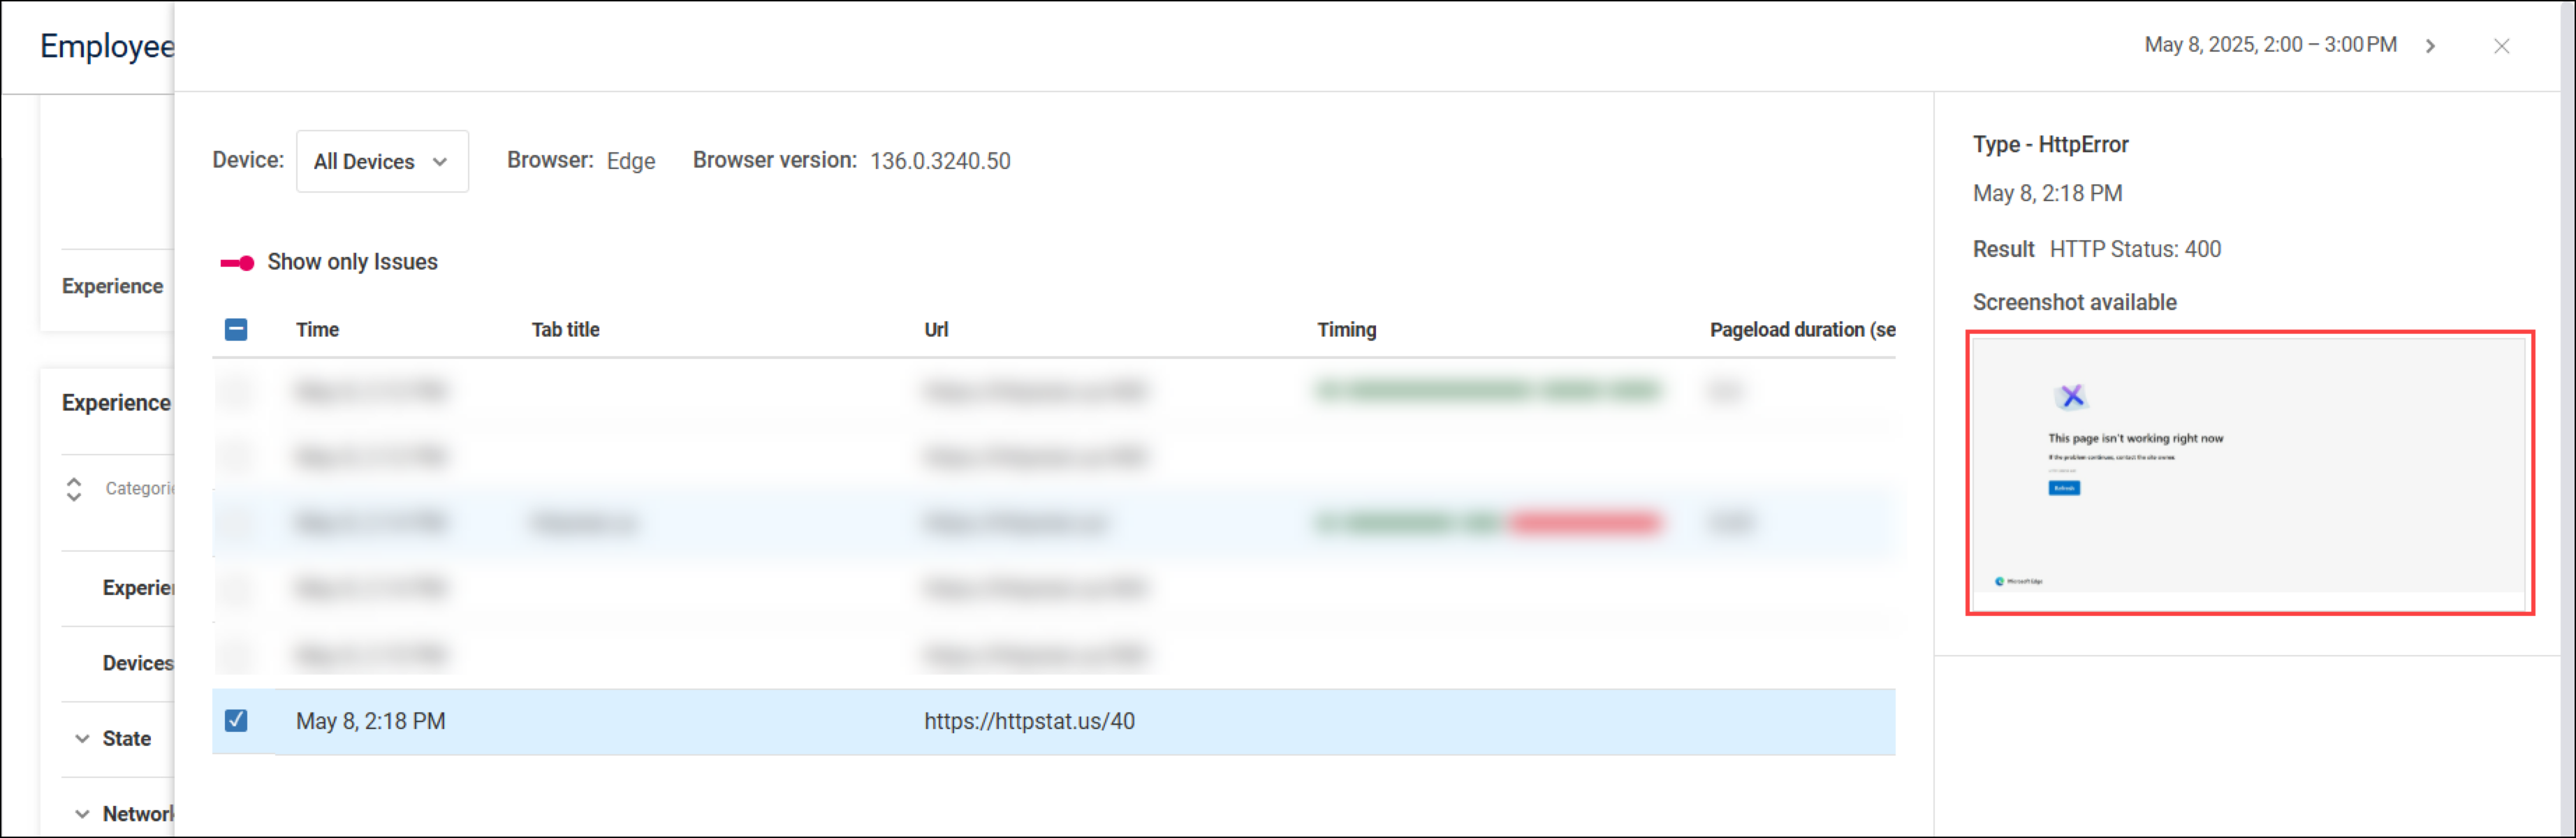
If you don't want to capture screenshots, go to Settings > ControlUp for Apps > Advanced and disable the option Capture screenshots for hard errors.
Page Load
Page load time performance is broken down into the following phases:
- Local - The time for the browser to locally process the request before attempting to make any connection or send the request to the server. This phase includes any URL redirecting.
- Connect - The time for the browser to establish a connection to the server (DNS resolution and HTTP/S negotiation).
- Backend - The time spent requesting and receiving data from the server.
- Client - The time for the browser to build the DOM and render the page.
- Total - The total page load time (the sum of the phases listed above).
If the page load time for an application is high, you can check which page load phases are contributing:
- If Local or Client is high, it indicates an issue with the client accessing the application.
- If Connect is high, it indicates there is an issue establishing a connection.
- If Backend is high, it indicates that either the network connection is slow or the server is underperforming (if the issue is due to the server, then you are likely to also see a related error).
Page load phases in ControlUp for Apps correspond to the following events in the web performance API.
- Local: From startTime to domainLookupStart
- Connect: From domainLookupStart to connectEnd
- Backend: From requestStart to responseEnd
- Client: From domInteractive to loadEventEnd
Click Show More to drill down into the Page load over time widget and see which URL paths and employees experienced the most page load incidents.
Time to First Byte (TTFB)
Time to first byte (TTFB) is the length of time it takes to receive the first byte of data after you go to a website. To receive the first byte:
- Your browser processes the request and establishes a connection to the server hosting the website.
- The server processes the request and starts sending data back to your browser.
- Your browser receives the first byte of data from the server.
A high TTFB can be caused by either a slow network connection between your browser and the server hosting the website or poor server performance.
While a high TTFB indicates bad performance, a low TTFB does not necessarily indicate good performance. After receiving the first byte of data, many more steps must be completed before you can view and interact with a website. As a rough guideline, Google recommends that most sites should have a TTFB of 800ms or lower.
Click Show More to drill down into the Time to first byte over time widget and see which URL paths and employees experienced the most TTFB incidents.
Errors
ControlUp for Apps records all errors experienced by the user (web navigation errors, web request errors, and HTTP status code errors). Some errors have very little impact and might not even be noticed by the user, while other errors completely stop the user from accessing the application. Errors with a severe user impact are classified as hard errors.
In the widgets displaying errors, you can hover over the error to see more information.
Click Show More to drill down into the Errors widget and see the employees and URL paths with the most errors.
Errors Classified as Hard Errors
The following web navigation errors are classified as hard errors:
- ERR_INVALID_AUTH_CREDENTIALS
- ERR_NAME_NOT_RESOLVED
- ERR_INTERNET_DISCONNECTED
- ERR_CONNECTION_TIMED_OUT
- ERR_TIMED_OUT
- ERR_NETWORK_CHANGED
- ERR_BLOCKED_BY_RESPONSE
- ERR_CONNECTION_CLOSED
- ERR_CONNECTION_REFUSED
- ERR_NETWORK_ACCESS_DENIED
- ERR_QUIC_PROTOCOL_ERROR
- ERR_ADDRESS_UNREACHABLE
The following HTTP status codes are classified as hard errors:
- 400
- 402-419
- 421-426
- 428
- 429
- 431
- 451
- 499
- 500-508
- 510
- 511
- 520-527
- 530
- 561
- 598