9.2: Incidents Pane Deprecated
From ControlUp for VDI version 9.2 and higher, the Incidents pane is deprecated from the Real-Time DX Console. You can now manage all recorded Windows Event Viewer incidents directly from the Events dashboard in DEX, giving you a more powerful way to track and manage incidents across your organization.
You can use the ControlUp for VDI Incidents pane to view incidents that were recorded in your organization based on incident triggers. Here you can investigate incidents retrospectively, such as changes in Stress Levels, user activity, and Windows Events. Each incident is recorded based on a trigger you configure in the Real-Time DX Console or with PowerShell cmdlets. Either manually, or with the help of ControlUp Hybrid Cloud Analytics, an incident is generated whenever its preconfigured conditions are met.
You can configure follow-up actions (e.g. send an email alert) but ControlUp will always store the incident in a database to be accessed later. For trending analysis and troubleshooting purposes, the Incidents pane is where you can search, sort, and group all incidents.
Revert Incidents Pane
From version 9.2 and higher, you can optionally revert the deprecated Incidents pane back to the Real-Time DX Console machine. To revert, apply the following registry settings to the machine:
Key: HKLM\SOFTWARE\Smart-X\ControlUp\Console
Value: EnableIncidentsTab
Data Type: DWORD
Data Value: 1
Incidents Pane Guidelines
The Incidents pane isn't available offline. Offline users of ControlUp will see the Incidents pane button greyed out.
Triggers are configured using the Triggers Settings window, where you can control which incidents will be recorded by ControlUp.
The Incidents pane is read-only and intended for viewing the incidents and performing data analysis by filtering, sorting and grouping data.
The default retention period for incidents is 14 days, and every organization is limited to 1,000 incidents per day by default. If these limitations aren't enough for your organization, contact our support team.
Incidents are stored securely using ControlUp Hybrid Cloud Services, subject to ControlUp privacy policy.
Searching and Filtering the Incidents Grid
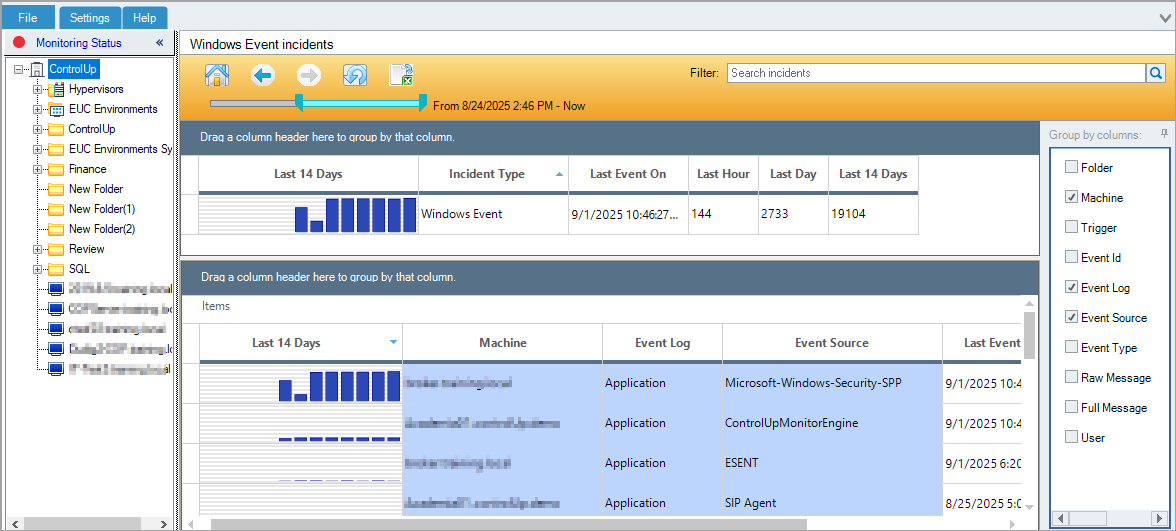
Use the Incidents grid to find relevant data with the following ways:
Filter/Search incidents box locates incident records by searching all data fields. Try machine names, user names or any other strings that might appear in the incidents, like parts of a Windows Event text.
Double-click any row in the grid to drilldown to a specific incident type. To return to the first screen, click the Home button or Back (<) on the top navigation bar.
Time range slider can be adjusted to display events that happened during a specified time range.
Click a folder or a machine in the organization tree to show incidents for that folder or machine.
All of the filtering options above instantly affect the Incidents grid, causing it to recalculate the distributions. If you filter the grid by any of these methods, the navigation bar will be highlighted in orange until all filters are cleared.
Incidents Home Page
The Incidents home page is the data grid showing all available incident categories, along with their distribution over time. It provides a summary of incident history in your ControlUp organization. Every row in this grid represents a distinct incident category, like Computer Stress or Windows Event.
Events are separated into these categories because every category has a distinct set of data fields. For example, a Computer Stress incident can’t be displayed in the same table as a Session State Changed incident since they don’t have the same properties.
The Incidents home page includes the following columns:
Graph column. Shows the relative distribution of every event type over time, during the retention period (14 days by default). The left end bar in each graph represents the number of incidents logged on the first day of this period. The right end bar represents the number of events logged today. By default, the graph is sorted by this column, with the most populated incident categories on top.
Incident Type. Incident category name.
Last Event On. Time of the last incident event recorded in this category.
Last hour, Last day, Last X day. (14 by default) Count of incidents within the category for the respective time frame.
To search incidents in a specific category, double click that category’s row.
Incidents Category View
After double-clicking any row in the Incidents home page, you arrive at the Incidents Category view, which shows all incidents of the selected type (for example, Computer Stress). Note that any filters previously applied on the Incidents home page will remain active, as indicated by the orange highlight of the navigation bar.
This view includes the same columns as the Incidents home page. In addition, all data fields of the selected incident type are available for display. To add a column, click its name in the right side bar.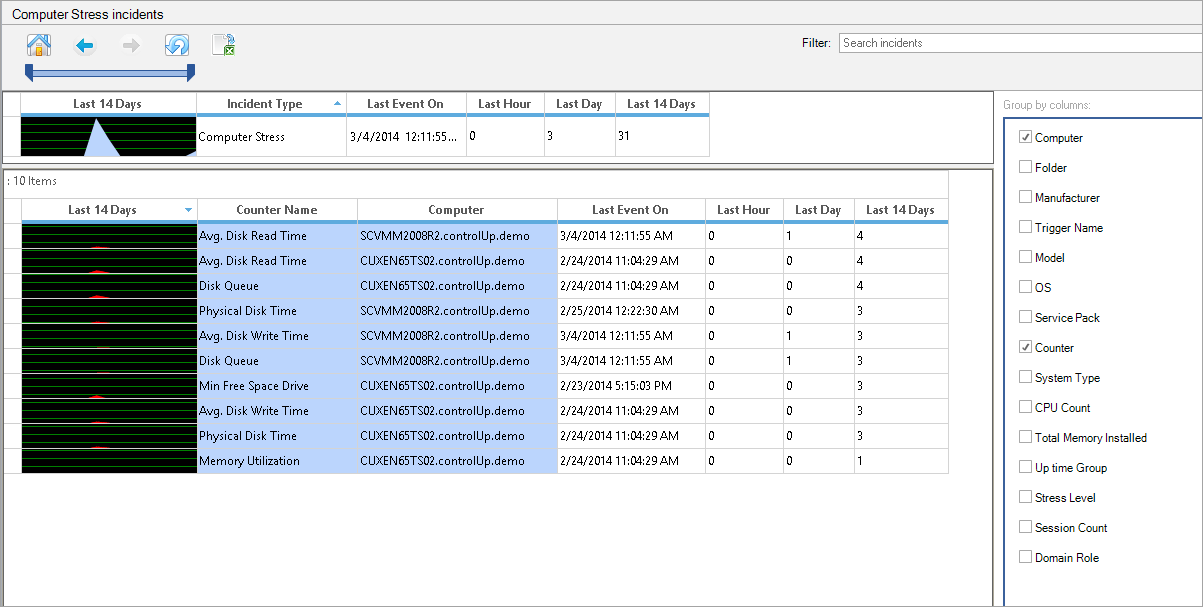
In the above example, we’ve added the Counter column to the Computer Stress incidents view. Once added, this column is added to the grouping logic of the incidents grid, dividing it into all unique combinations of the selected field values.
If you originally had 10 machines in the Computer Stress view, adding the Stress Level column will divide every machine row into all existing values of Stress Level column on that machines (to a maximum of 10*4=40 rows, if every machine has triggered all possible stress levels).
You can add multiple columns the same way. This powerful data mining feature enables you to identify the most common factors contributing to incidents in your organization. For example, in Computer Stress Level events the Counter column shows the specific counters responsible for each Stress Level incident. When added to this view together with the Computer Name column, the default sorting should highlight the specific resource that causes the most Stress Level events (e.g. Memory Utilization on Server1).
To switch the grid to the Individual Incidents view, double-click a row in this table.
Individual Incidents View
The Individual Incidents view displays the separate instances of any incident recorded by ControlUp. Unlike the other views in the Incidents pane, each row in this view is not a summary, but rather an individual incident.
For each incident, all recorded details are displayed (see column reference below). In addition, this view includes the Trigger column which links to the trigger that caused every incident to be recorded, so that you can easily tune the relevant triggers.
Note that the trigger causing a particular event might have been deleted since the incident had been recorded. In this case, the Trigger column will show <trigger deleted>.
Incidents Pane Column Reference
Home Page Columns
Column | Description |
Incident type | Incident category, as configured when creating the trigger |
Last incident on | Time of the last incident recorded in this category |
Last hour, Last day, Last X days (14 by default) | Count of incidents within the category for the respective time frame |
Incidents Category View Columns
Column | Description | ||
Incident type | Incident category, as configured when creating the trigger. Events are separated into these categories because every category has a distinct set of data fields. For example, a Computer Stress incident can’t be displayed in the same table as a Session State Changed incident since they don’t have the same schema. | ||
Last incident on | Time of the last incident recorded in this category | ||
Last hour, Last day, Last X days (14 by default) | Count of incidents within the category for the respective time frame | ||
Folder Stress Columns | |||
Stress Level | Stress Level severity recorded during the incident | ||
Folder | Name of the folder in your ControlUp organization | ||
Trigger | Name of the trigger that caused the incident to be recorded (links to the trigger’s settings). Could be empty if the trigger was deleted. | ||
Counter Name | ControlUp column responsible for the increase in the machine’s Stress Level | ||
Hosts Stress Columns | |||
Stress Level | Stress Level severity recorded during the incident | ||
Folder | Name of the folder in your ControlUp organization | ||
Trigger | Name of the trigger that caused the incident to be recorded (links to the trigger’s settings). Could be empty if the trigger was deleted. | ||
Counter Name | ControlUp column responsible for the increase in the computer’s Stress Level | ||
Host Name | Name of the affected virtualization host | ||
Hypervisor Type | Hypervisor platform vendor | ||
Version | Version number of the hypervisor platform | ||
Installed Memory | Amount of physical RAM installed on the host | ||
Computer Stress Columns | |||
Computer | Name of the machine on which the incident has occurred | ||
Folder | Name of the ControlUp organization tree folder in which the machine resides | ||
Trigger name | Name of the trigger that caused the incident to be recorded (links to the trigger’s settings). Could be empty if the trigger has been deleted. | ||
Manufacturer | Hardware manufacturer of the stressed machine | ||
Model | Hardware model of the stressed machine | ||
OS | Operating system of the stressed machine | ||
Service Pack | OS service pack installed on the stressed machine | ||
Counter | ControlUp column responsible for the increase in the machine’s Stress Level | ||
System Type | System bitness (x86/x64) of the stressed machine | ||
CPU Count | Number of CPUs installed on the stressed machine | ||
Total Memory Installed | Amount of physical memory on the stressed machine | ||
Uptime Group | Uptime of the stressed machine, categorized (1 hour – 1 day, 1 day – 1 week, 1 week – 1 month) | ||
Stress Level | Stress Level severity recorded during the incident | ||
Session Count | Number of user sessions established on the stressed machine, categorized (0-2,3-5,6-10, etc.) | ||
Domain Role | Domain role of the stressed machine | ||
Host Name | For a virtual machine, the name of the hypervisor host on which the machine was running at the time of the incident | ||
Hypervisor Type | For a virtual machine, the vendor of the hypervisor host | ||
Session Stress Columns | |||
Account Name | User account name of the stressed session | ||
Account Domain | User account domain of the stressed session | ||
Computer | Machine on which the stressed session was hosted | ||
Folder | ControlUp organization folder in which the machine hosting the session resides | ||
Counter | ControlUp column responsible for the increase in the session’s Stress Level | ||
Trigger name | Name of the trigger that caused the incident to be recorded (links to the trigger’s settings) | ||
Client name | Name of the client machine from which the stressed session has been established | ||
Session state | State of the user session at the time of the incident | ||
Initial program | Program configured to start when the session is initialized (or published application) | ||
Process Stress Columns | |||
Image name | Name of the stressed process | ||
EXE version | Version number of the stressed process | ||
Product name | Product name of the stressed process | ||
Product version | Product version number of the stressed process | ||
Manufacturer | Manufacturer of the stressed process | ||
User name | Name of the user who launched the process | ||
Description | Description of the stressed process | ||
Computer | Machine on which the stressed process was executed | ||
Folder | ControlUp organization folder in which the machine hosting the stressed process resides | ||
Command line | Command used to launch the process, including the full path and command-line arguments | ||
Priority | Base CPU priority of the stressed process | ||
Created time | Creation timestamp of the stressed process’s executable file | ||
Modified time | Last modification timestamp of the stressed process’s executable file | ||
Account Stress Columns | |||
Account name | Name of the user account | ||
Account domain | AD domain name of the user account | ||
Total sessions | Total number of sessions established using the user account | ||
Total processes | Total number of processes executed using the user account | ||
Stress Level | Stress Level severity recorded during the incident | ||
Application Stress Columns | |||
Image name | Name of the process executable | ||
Total processes | Number of process instances for the executable | ||
EXE version | EXE version of the executable file | ||
Stress Level | Stress Level severity recorded during the incident | ||
Windows Event Columns | |||
Event log | Name of the Windows Event Log in which the event was logged | ||
Event type | Type of the event – Error, Warning, Information, Audit Success / Failure | ||
Event ID | Event ID number | ||
User | User field as logged in the event | ||
Computer | Machine on which the event was logged | ||
Full message | Full text of the event | ||
Event source | Source of the event | ||
Raw message | Raw message text of the event (without substituted parameters) | ||
Folder | ControlUp organization folder in which the machine that logged the event resides | ||
Process Started Columns | |||
Image name | Name of the started process | ||
Image version | Executable version of the started process | ||
Command line | Command used to launch the process, including the full path and command-line arguments | ||
User | User who launched the process | ||
Computer | Machine on which the process was launched | ||
Folder | ControlUp organization folder containing the machine on which the process was started | ||
Process Ended Columns | |||
Image name | Name of the ended process | ||
Image version | Executable version of the ended process | ||
Command line | Command used to launch the process, including the full path and command-line arguments | ||
User | User who launched the process | ||
Computer | Machine on which the process ended | ||
Folder | ControlUp organization folder containing the machine on which the process ended | ||
Exit code | Exit code recorded when the process ended | ||
User Logged On, User Logged Off, and Session State Changed Columns | |||
User name | User name of the established session | ||
Machine name | Machine hosting the session | ||
Initial program | Program configured to start when the session is initialized (or published application) | ||
Session ID | Session ID number | ||
Session State Changed Columns (in addition to the above) | |||
From state | Session state before the change | ||
To state | Session state after the change | ||
Computer Down Columns | |||
Computer | Name of the machine disconnected from monitoring | ||
Action | Reason for disconnection | ||
Error description | Description of the error that led to disconnection | ||
Folder | ControlUp organization folder containing the machine | ||
NetScaler Stress Columns | |||
NetScaler Name | Name of the NetScaler on which the incident has occurred | ||
Version | NetScaler version | ||
Load Balancer Name | Name of the Load Balancer on which the incident has occurred | ||
LB Service Group Name | Name of the Service Group on which the incident has occurred | ||
LB Service Name | Name of the Service on which the incident has occurred | ||
Gateway Name | Name of the Gateway on which the incident has occurred | ||
NIC ID | ID of the NIC on which the incident has occurred | ||
Load Balancers Stress Columns | |||
NetScaler Name | Name of the NetScaler on which the incident has occurred | ||
Version | NetScaler version | ||
Load Balancer Name | Name of the Load Balancer on which the incident has occurred | ||
LB Service Group Name | Name of the Service Group on which the incident has occurred | ||
LB Service Name | Name of the Service on which the incident has occurred | ||
Gateway Name | Name of the Gateway on which the incident has occurred | ||
NIC ID | ID of the NIC on which the incident has occurred | ||
LB Services Stress Columns | |||
NetScaler Name | Name of the NetScaler on which the incident has occurred | ||
Version | NetScaler version | ||
Load Balancer Name | Name of the Load Balancer on which the incident has occurred | ||
LB Service Group Name | Name of the Service Group on which the incident has occurred | ||
LB Service Name | Name of the Service on which the incident has occurred | ||
Gateway Name | Name of the Gateway on which the incident has occurred | ||
NIC ID | ID of the NIC on which the incident has occurred | ||
LB Services Groups Stress Columns | |||
NetScaler Name | Name of the NetScaler on which the incident has occurred | ||
Version | NetScaler version | ||
Load Balancer Name | Name of the Load Balancer on which the incident has occurred | ||
LB Service Group Name | Name of the Service Group on which the incident has occurred | ||
LB Service Name | Name of the Service on which the incident has occurred | ||
Gateway Name | Name of the Gateway on which the incident has occurred | ||
NIC ID | ID of the NIC on which the incident has occurred | ||
Gateways Stress Columns | |||
NetScaler Name | Name of the NetScaler on which the incident has occurred | ||
Version | NetScaler version | ||
Load Balancer Name | Name of the Load Balancer on which the incident has occurred | ||
LB Service Group Name | Name of the Service Group on which the incident has occurred | ||
LB Service Name | Name of the Service on which the incident has occurred | ||
Gateway Name | Name of the Gateway on which the incident has occurred | ||
NIC ID | ID of the NIC on which the incident has occurred | ||
NICs Stress Columns | |||
NetScaler Name | Name of the NetScaler on which the incident has occurred | ||
Version | NetScaler version | ||
Load Balancer Name | Name of the Load Balancer on which the incident has occurred | ||
LB Service Group Name | Name of the Service Group on which the incident has occurred | ||
LB Service Name | Name of the Service on which the incident has occurred | ||
Gateway Name | Name of the Gateway on which the incident has occurred | ||
NIC ID | ID of the NIC on which the incident has occurred | ||