Introduction
Score columns provide general health information about your machine resources, such as CPU, Memory or Network as well as user experience metrics.
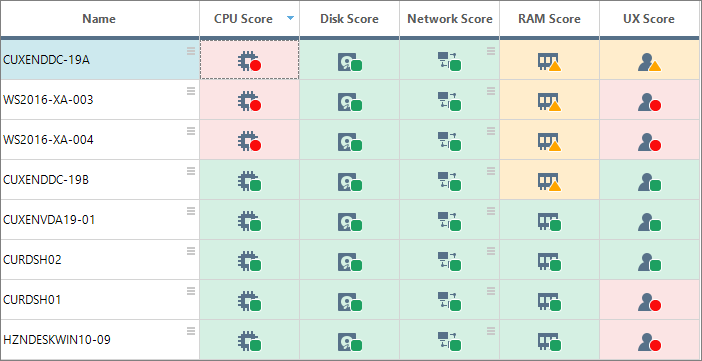
This article outlines all available score columns and their underlying metrics and in which view (tab) you can find the score. If a score is accessible through multiple views, then the metrics within the specific view being analyzed are the only ones that contribute to that score. For instance, the CPU score can be accessed in both the Machines and Hosts view. When analyzing the CPU score in the Hosts view, only the metrics in the Hosts view are taken into account for that score.
Exploring Metrics for a Selected Score
To view additional information about the metrics used to calculate a score, double-click on the corresponding score column.
In this case, the Paging File metrics crosses a yellow threshold while the other metrics are green.
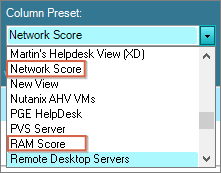
You can also choose a score from the column preset. This will filter and display only the metrics that are relevant to the selected score.
Client Device Score
As the Client Device Score is based on Remote DX metrics, you need to install the Remote DX on the client device
Available in View: Sessions
- Client CPU
- Internet Latency
- ISP Latency
- LAN Latency
- Total Session Latency
- WiFi Signal
CPU Score
Available in View: Machines
- AWS CPU Utilization
- CPU
- CPU Excessive SMP use
- CPU Ready
- CPU System time
- CPU Swap Wait
- Host CPU Usage
- Processor Queue Length
Available in View: Host
- CPU Usage %
- vCPU/pCPU Ratio
Disk Score
Available in View: Hosts
- Datastore R/W IOPS
- Datastore Read latency
- Datastore Read Rate
- Datastore Write latency
- Datastore Write Rate
- Disk device latency
- Disk kernel latency
- Disk Queue Depth
- Min Free Space Datastore
- Storage Repository total latency
Available in View: Machines
- Avg. Disk Read Time
- Avg. Disk Write Time
- AWS Disk Read Operations
- AWS Disk Write Operations
- Disk Queue
- Disk Reads / sec
- Disk Transfers / sec
- Disk Writes / sec
- Free Space on System Drive
- Min Free Space Drive
- Virtual Disk Avg. Latency
- Virtual Disk Read IOPS
- Virtual Disk Read Latency
- Virtual Disk Reads KBps
- Virtual Disk Write IOPS
- Virtual Disk Writes KBps
- Virtual Disk Write Latency
Network Score
Available in View: Machines
- AWS Network In
- AWS Network Out
- Dropped Received Packets
- Dropped Transmitted Packets
- Net Received
- Net Sent
- Net Total
Available in View: Hosts
- NIC dropped received packets
- NIC dropped transmitted packets
- NIC received packets errors
- NIC transmitted packets errors
- NIC Usage
RAM Score
Available in View: Machines
- Active memory
- Dynamic Memory Avg.Pressure
- Memory Demand
- Memory SwapIn Rate
- Memory SwapOut Rate
- Memory Utilization
- Non - paged Pool Memory
- Paging File
- Pages / sec
- Physical memory used
- PVS RAM Cache Usage
Resource Consumption Score
Available in View: Sessions
- Bandwidth Avg
- Bandwidth Last
- Bandwidth Limit
- CPU
- CVAD HDX Connection Load Time
- I/O Read Operations/sec
- I/O Write Operations/sec
- Latency Avg
- Latency Last
- Memory (Private Bytes)
- Memory (Working Set)
- Page Faults /sec
- RTT
UX Score
Available in View: Machines
- Avg. App Load Time
- Avg. Logon Duration
- Avg. User Input Delay
- CVAD Average Logon Duration
- Disk Queue
- Max User Input Delay
- Non Zero Avg User Input Delay
- Non Zero Max User Input Delay
Available in View: Sessions
- Avg. App Load Time
- Bandwidth Avg
- Bandwidth Last
- CVAD Authentication Duration
- CVAD Brokering Duration
- CVAD Group Policy Load Time
- CVAD HDX Connection Load Time
- CVAD Interactive Session Load Time
- CVAD Logon Duration
- CVAD Logon Scripts Load Time
- CVAD Profile Load Time
- Desktop Load Time
- Group Policy Load Time
- Latency Avg
- Latency Last
- Logon Duration
- Logon Duration - Other
- Logon Time
- Non Zero User Input Delay
- Profile Load Time
- RTT
- User Input Delay