The Site Load Scout provides comprehensive statistics when loading a website, including how long it took, what content was loaded, and how fast each content type loaded.
Create a Site Load Scout
In the Synthetic Monitoring top bar, click Create Scout to open the Add New Scout window.
From the Applications tab, select Site load as the Scout Type.
Select the locations (Hives) from which you want to initiate the test.
Enter the URL of the site you want to test. You must include "http" or "https" at the beginning of the URL.
Enter a Name for the Scout.
Select how often you want to test the resource using the Run Every slider. You can choose any interval from 5 to 60 minutes, in increments of 5 minutes (5, 10, 15, 20, and so on).
Optionally, add Tags to your Scout. Tags are key-value pairs which can be used to organize your Scouts. To learn more about tags, visit Centralized Tags Management.
Optionally, click Show additional parameters to configure the following:
SSL Verify. Sets whether the Scout checks for a trusted SSL certificate on the website. If you select Yes and the certificate isn't trusted, then the test fails.
Timeout. Sets the maximum wait time for the test to finish.
Look for a string in the response. Sets a string that the Scout searches for in the response. If the string isn't found, then the test fail.
Success Codes. Sets which HTTP status codes the Scout considers a successful response.
Click Next: Alert Policy to set up alerts and notifications on the Scout before saving it. For more information, visit Alert Policies.
Test Results
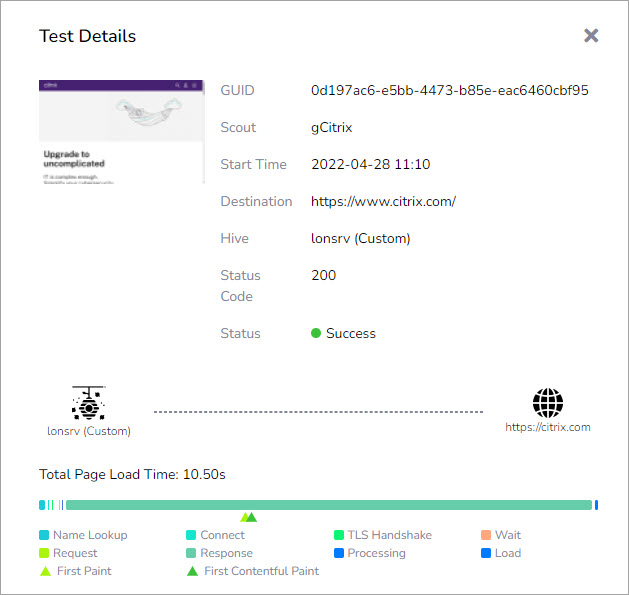
Click on a test result to see the full details of the Site Load test. In this example, you can see the type of information that is returned for a Site Load test to https://www.citrix.com.
You can see a summary of the Scout configuration, a screenshot of the website, and page load statistics.
Filter Test Results
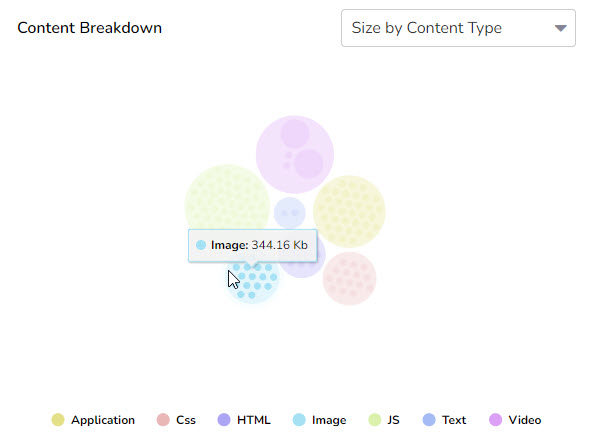
From the same result window, you can display performance metrics in circle-packing diagrams.
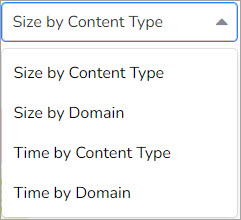
Size by Content Type shows the size of the various content types, such as CSS, HTML, or images.
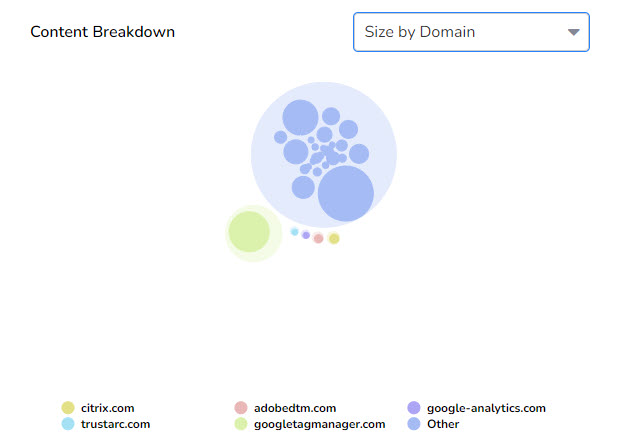
Size by Domain shows the content size, sorted by domain.
Time by Content Type shows the loading time for each type of content.
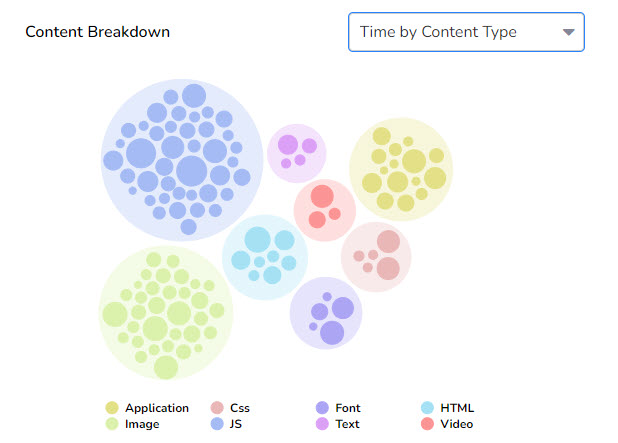
In this view, you can also fine-tune the search result by viewing which image took the longest to load. In this example, the img-22-gartner-market-guide.jpg file loaded in 1.77 seconds.
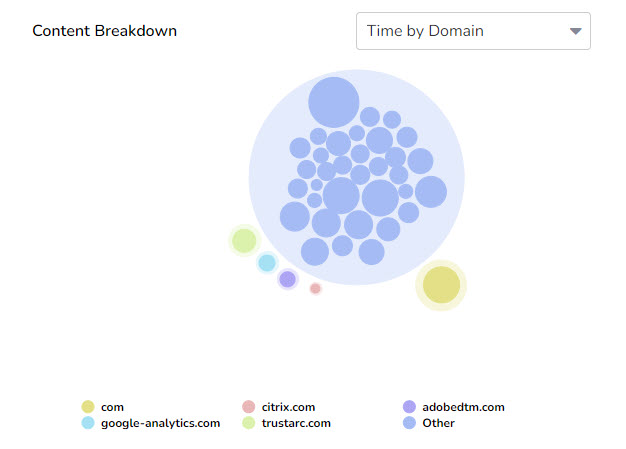
Time by Domain shows the loading time of the content, sorted by domain.
This window also displays information about the loaded content. Click on the arrow at the end of the line to view the Overview of the content. In this example, a font with a size of 117.80 KB was loaded in 1.73 seconds.
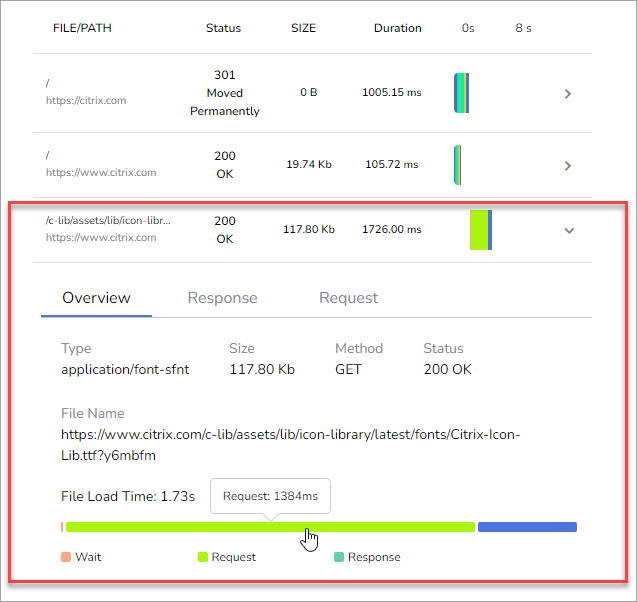
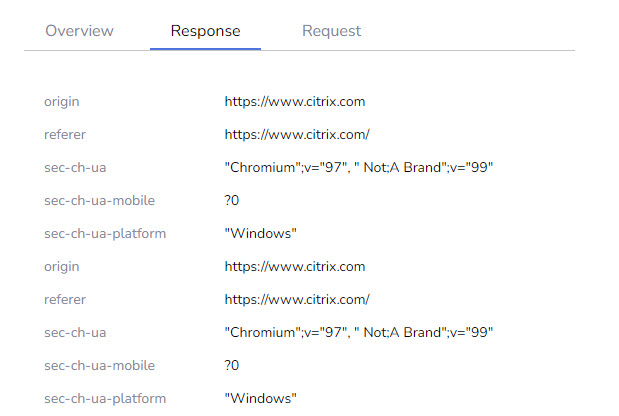
You can find more information on the relevant tab. For example, you can see the response sent back from the website in the Response tab.
