The User Session Details report shows historical metrics for a specific user session. Use this report to answer questions like:
Was a user's problem caused by a resource usage or their client device's internet connection?
Was a user's problem caused by resource usage on their session or other activity on the same machine?
How was CPU usage affected when a user launched a certain application during their session?
How to Access the Report
To access the User Session Details report, go to the Session Activity report and click on the User Name of a user session to see more details.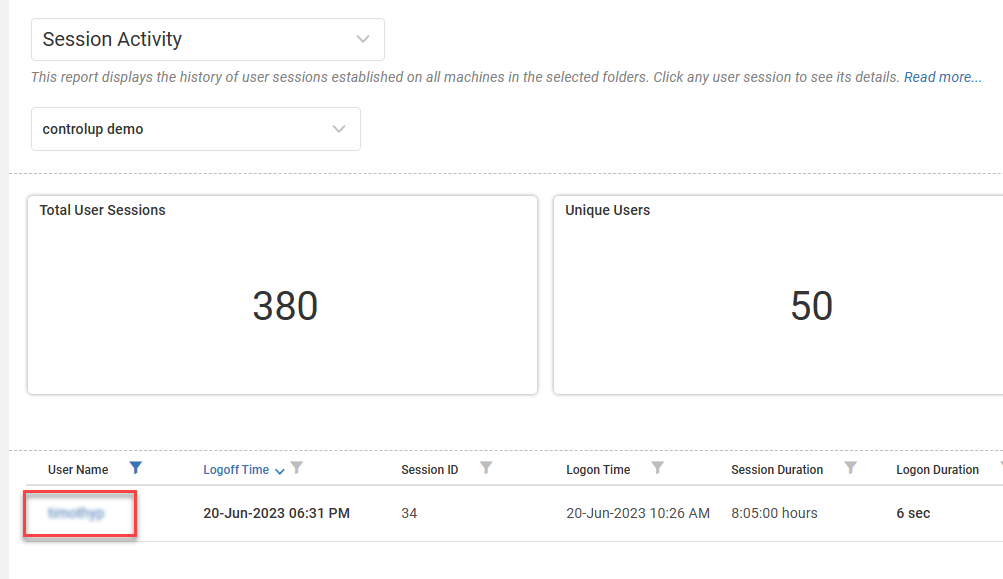
The User Session Details opens for the user session you selected.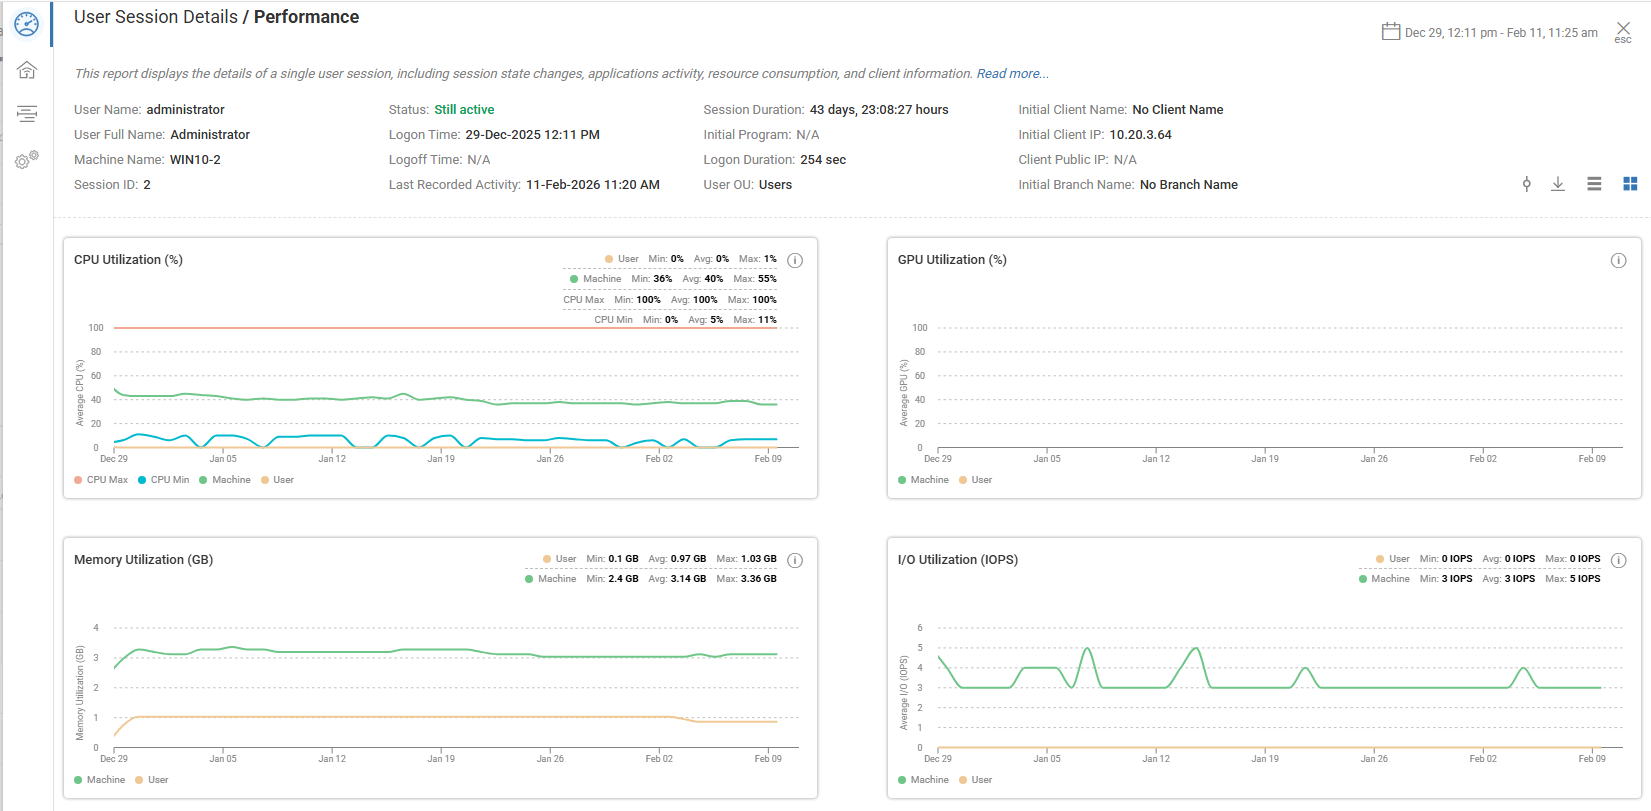
Report Data
The report includes the following sections. You can click the buttons on the left to quickly view each section: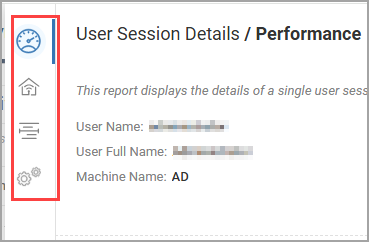
Performance
The Performance view shows metrics about the user session's resource usage and performance. The charts show the usage from both the user session and the overall usage on the machine. This helps you identify if a problem is caused by resource usage on the session or from other activity on the machine.
Click on a data point to see which processes and users were consuming the most resources on the machine at that time. You can click and drag the mouse across a specific time period on a chart to zoom in on that time period. The custom time range you select is applied to all the charts in the report.
Performance includes the following charts:
Chart | Displayed Metrics |
|---|---|
CPU Utilization (%) | Minimum, average, and maximum CPU utilization for the host Machine and the User. Click a data point on the chart to show the top CPU consumers and the minimum, average, and maximum CPU utilization for both the machine and the user. The ControlUp Monitor collects CPU data from the ControlUp Agent every 3 seconds (about 100 samples per 5‑minute interval). Each interval’s Machine Min and Machine Max values are taken from the highest and lowest of those 3‑second samples. This chart displays CPU utilization in 5‑minute intervals: • Machine Avg – Average CPU usage of the host machine during the interval • User Avg – Average CPU usage of the user session during the interval
|
GPU Utilization (%) | Average of total GPU utilization for both the user and the host machine. |
Memory Utilization (GB) | Minimum, average, and maximum RAM utilization for both the user and the host machine. |
I/O Utilization (IOPS) | Minimum, average, and maximum I/O utilization for both the user and the host machine. Note that machine I/O is calculated using disk performance metrics. User I/O is derived from process I/O metrics which summarize all process I/O activity including both disk and non-disk I/O (such as network and device data). For this reason, user metrics might appear higher than machine metrics. |
Protocol Latency (ms) | Minimum, average, and maximum protocol latency of the user session. |
Protocol Bandwidth (Mbps) | Average data transfer rate for the user session's remoting protocol, and its theoretical bandwidth limit over time. |
Application Load Time (sec) | Time taken by applications in the user session to become ready for the user, as defined by Application Load Time settings in the Real-Time DX Console. Click a data point on the chart to show the top load time consumers for each application. Note that application load time is measured only for these specific defined applications, and doesn't include the applications launched in the current user session. |
Remote DX
Remote DX shows metrics from the client device (network latency, WiFi signal strength, and packet loss). Client device metrics are available only if the Remote DX plugin is installed on the client device. Learn more about Remote DX.
Remote DX includes the following charts:
Network Latency. LAN, internet, and total latency measured from the client device connected to the user session.
Wi-Fi Signal Strength. Wi-Fi signal strength of the client device connected to the user session.
Client Packet Loss. Percentage of network packet loss on the client device connected to the session.
Gantt
Gantt shows a Gantt chart of the user's activity during the session, including:
User logon. Shows the login time when the session was established.
Changes in the session state. Shows each time the state changed during the session (active/idle).
User logoff. Shows the logoff time when the session ended.
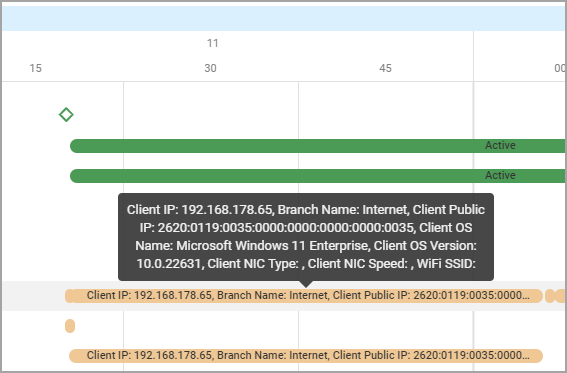
Changes in the client device. Shows different client details and when they changed during the session. Hover over a bar to see the specific details during each part of the session, such as client IP, branch name, client public IP, client OS name, client OS version, client NIC type, client NIC speed, and WiFi SSID.
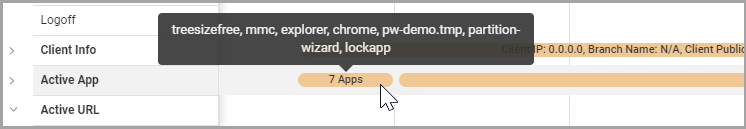
Active applications launched by the user. Shows the active applications that the user launched during the session. If the user launched multiple active applications simultaneously, it shows the number of active applications launched during the same time. Hover over a bar to see the active application names.
Active URLs connected to by the user. Shows the active URLs that the user connected to during the session.
Optionally, background processes in the session. To show processes, click the Show Session processes toggle at the top of the report and you can see the processes as a dropdown option in the Gantt chart.
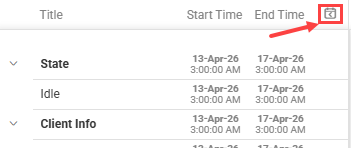
To view the Start and End times of each item, click the schedule icon at the top of the chart:
Processes Grid
To view a grid displaying all the processes running in this user session, click the Processes icon on the left menu of the User Session Details report:![]()
This grid includes the following:
Process name. Click a process name to open the App Trends report for the app this process is running.
Process display name. The name of the app the process is running.
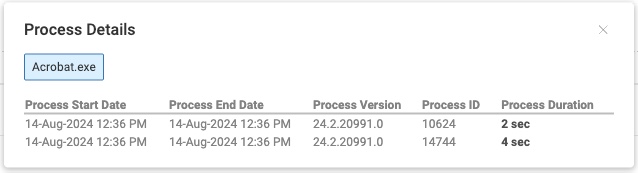
Total Processes. The number of times this process has run in this user session. Click a number to view a Process Details popup displaying the following for each instance of the process:
Process Start Date
Process End Date
Process Version
Process ID
Process Duration