Feature available only in version 9.2.5
This article describes monitor features only available in ControlUp Real-Time DX version 9.2.5.
ControlUp has replaced the legacy events experience in the Real-Time DX Console with a new, highly scalable, rule-driven Windows Event Logs Monitoring capability in DEX. This feature provides your organization with complete flexibility to monitor any critical Windows event across your environment while maintaining strict control over data processing overhead.
To configure the Windows Event Logs page, go to your DEX platform Settings > VDI > Windows Event Log:

Windows Event Logs
Unlike traditional event forwarding models, this architecture moves event processing directly to the edge. The ControlUp Agent evaluates Windows events locally on the endpoint against your specific criteria (Log, Source, Event ID, and Level).
By only forwarding matching events to the cloud-based Windows Event Log, background noise is filtered out instantly, keeping your data volume and associated cloud costs completely predictable. Furthermore, ControlUp Agents dynamically ingest configuration updates on the fly, eliminating the need to modify local registry entries or perform agent service restarts.
The Windows Event Log retains data for up to 30 days.
Key Benefits
Out-of-the-Box Intelligence: Ships with over 40 preconfigured default rules organized by a standardized Vendor – Product – Subject naming convention for fast sorting and clear context.
Comprehensive Infrastructure Coverage: Default rules instantly capture system health, authentication issues, Group Policy behavior, Windows Updates, Windows Defender activity, and core user session lifecycles across RDS, Citrix, Omnissa, AWS, FSLogix/UPM, and Hyper-V/AVD.
Noise-Controlled Enablement: To safeguard your existing monitoring baselines from unexpected alerts or volume spikes, this feature is managed selectively based on your organization:
New Orgs: The preset rules are enabled out of the box so you see immediate value on day one.
Existing Orgs: The preset rules are deployed in a disabled state, allowing you to safely opt-in and configure settings when ready.
Rules List
In the Windows Event Log , you can review your active events rules list. To turn off all of the rules on the list, click the Disable toggle on the top-right.
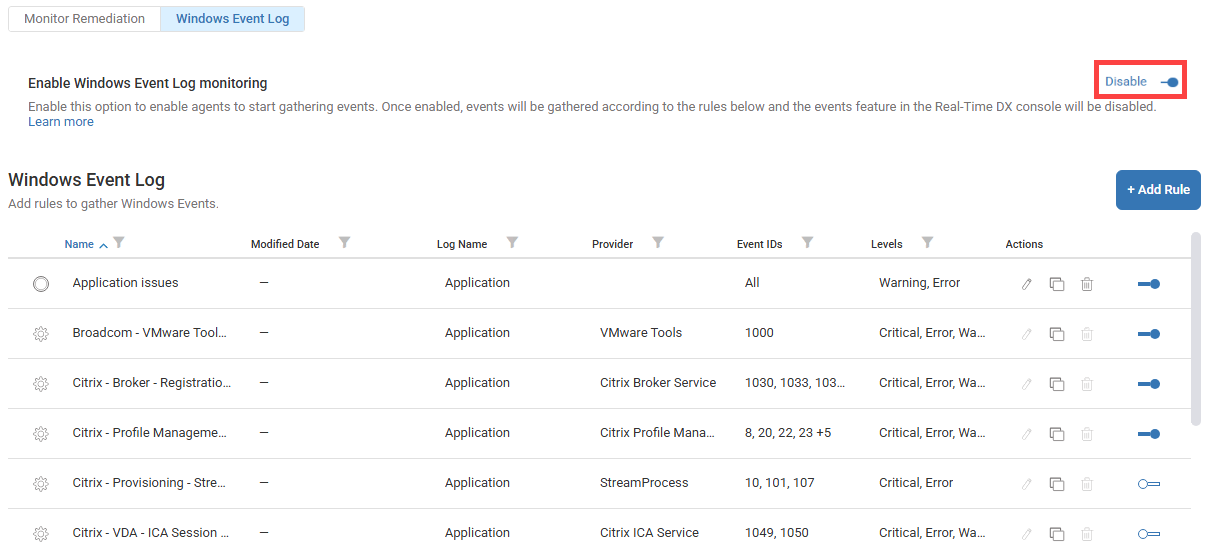
The rules list displays the following information for each rule:
Name: A descriptive name assigned to the rule, making it easy to understand its purpose.
Modified Date: The date and time when the rule was last updated.
Log Name: Specific path to track system and application activity.
Provider: Optional provider name.
Event IDs: Comma-separated event IDs.
Levels: Indicates the severity and/or importance of a recorded event.
Actions: This column contains the following options to perform on the rule:
Edit. Default rules can’t be edited.
Duplicate. Create a new rule based on a template of the selected rule.
Delete. Default rules can’t be deleted.
To build a new filtering configuration tailored to your organization’s application stack, click + Add Rule on the top-right corner of the rules list.
To enable or disable a rule, click the toggle on the right end of the row.
Known Issue
If the default rules don't appear the first time you open the Windows Event Log settings, click the Disable toggle (top-right), then click it again to re-enable, and refresh the page.
Add Rule
To add a new rule to the rules list:
Click + Add Rule. The Create Rule popup opens.
Enter information in the following mandatory fields:
Name
Log Name
Optionally, enter information as needed in the following fields:
Provider Name
Event IDs
Event ID Ranges. To add a range, click Add Range. Repeat to add additional ranges if needed.
Event ID
To prevent excessive data collection, define at least one Event ID or Event ID Range filter.
Optionally, select Levels as needed.
Click Create Rule.
The new rule now appears on the list.
Windows Event Logs Page
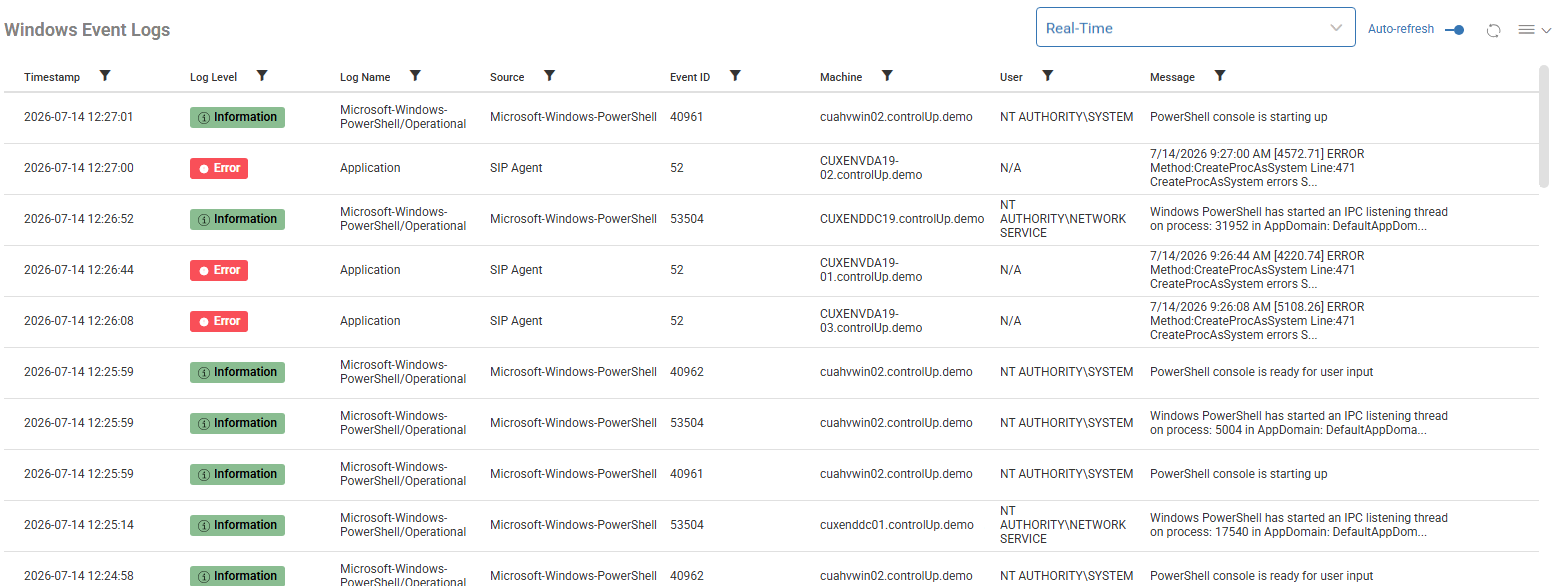
The Windows Event Logs page contains the Windows Event Logs list. You can filter the list by selecting one of the following time ranges from the dropdown on the top-right:
Real-Time
Last 24 Hours
Last 7 Days
Last 30 Days
The list displays the following information:
Timestamp
Log Level
Log Name
Source
Event ID
Machine
User
Message
Click a row under the Message column to open the Event Details panel for the specific event log.
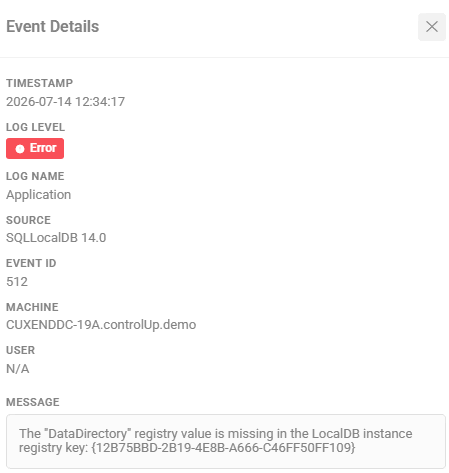
The Event Details panel displays the full metadata for the selected log entry.